
Markets

Economic Calendar
8:30 Import/Export Prices
10:00 Consumer Sentiment
11:00 Fed’s Kashkari: “Energy and Inflation: Drivers and Solutions”
12:00 PM Fed’s Mester Speech
1:00 PM Baker-Hughes Rig Count
https://www.investing.com/economic-calendar/
***New: PTG Trading Room Chat Log’s Link
S&P 500

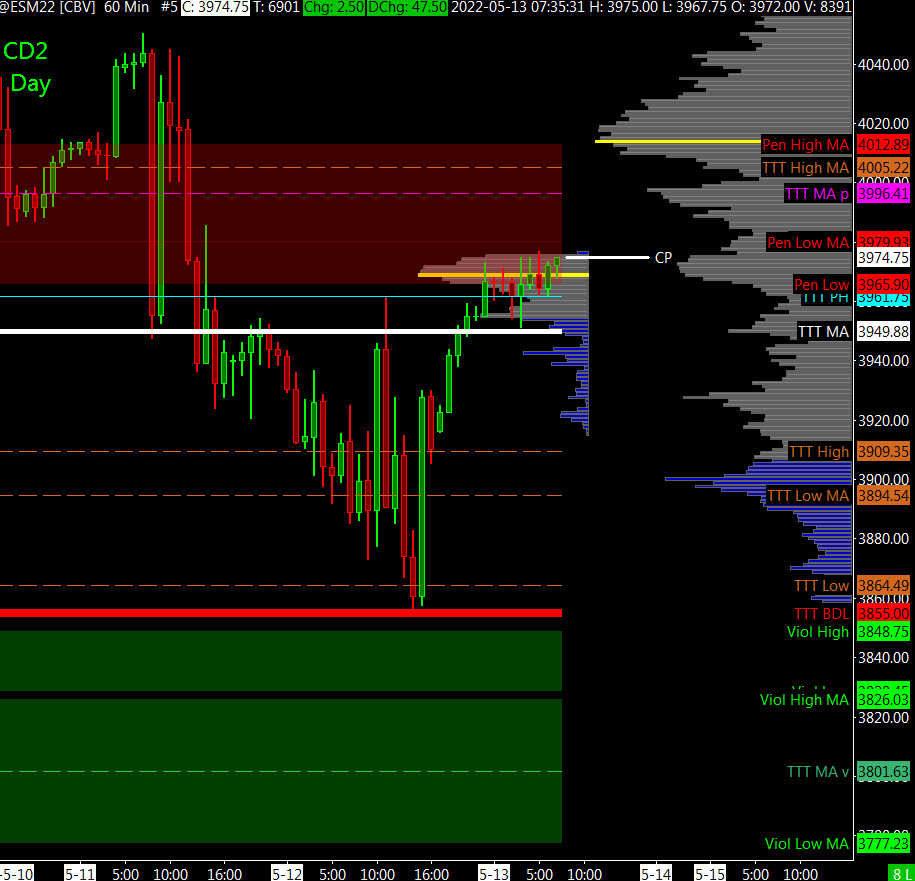
Prior Session was Cycle Day 1 (CD1): Normal Cycle Day 1 with low in-place at 3855. Prior range was 107 handles on 2.324M contracts exchanged.
…Transition from Cycle Day 1 to Cycle Day 2
This leads us into Cycle Day 2 (CD2): Normal is for some ‘back n fill’ consolidation activity to balance previous session with CD1 Low marked at 3855. Being Friday, bulls have an opening to stage a relief rally to avert dipping into 20% Bear territory. Overnight trade has price above prior range high within 3 Day Central Pivot Zone. As such, estimated scenarios to consider for today’s trading.
Bull Scenario: Price sustains a bid above 3955, initially targets 3985 – 3995 zone.
Bear Scenario: Price sustains an offer below 3955, initially targets 3935 – 3930 zone.
PVA High Edge = 3930 PVA Low Edge = 3888 Prior POC = 3900
Range Projections and Key Levels (ES) June 2022 (M) Contract
HOD ATR Range Projection: 4044; LOD ATR Range Projection: 3848; 3 Day Central Pivot: 3962; 3 Day Cycle Target: 3970; 10 Day Average True Range 129; VIX: 30
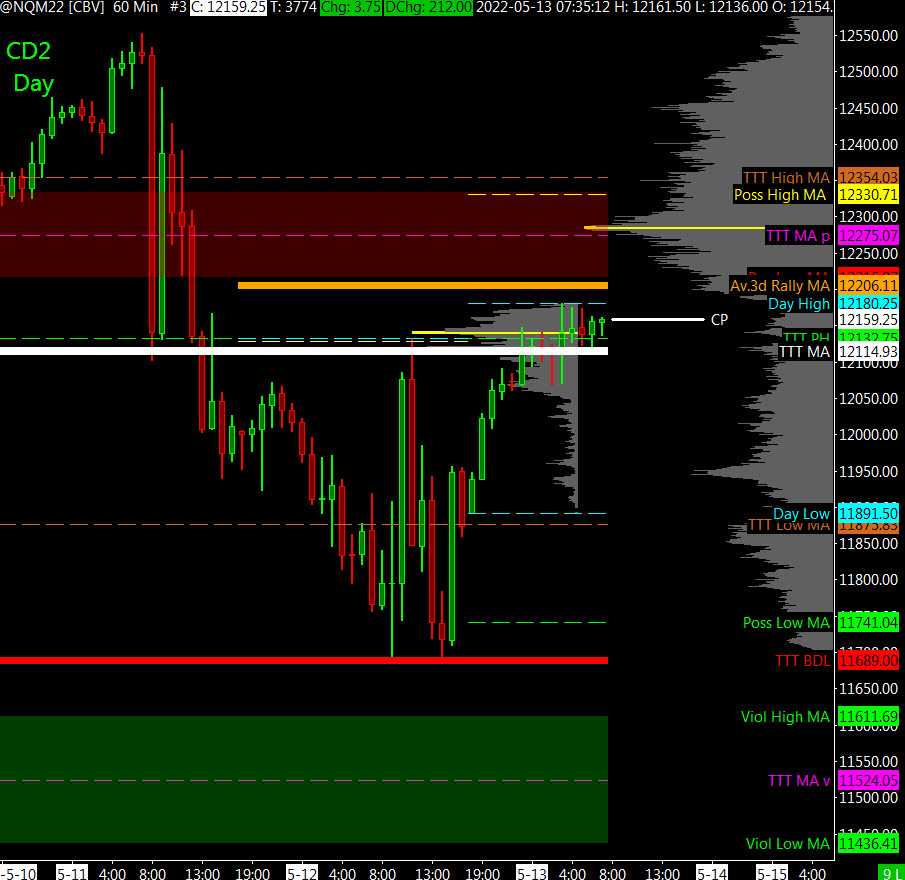
Nasdaq 100 (NQ)

Today is Cycle Day 2 (CD2)…Today we’ll be looking for a CD2 “normal” for price to stabilize prior session selling. CD1 low is marked at 11689. Bulls have an opportunity to stage a relief rally…Will they be successful? Prior range was 444 handles on 869k contracts traded. As such, there are two estimated scenarios to consider for today’s trading.
Bull Scenario: IF Bulls sustain a bid above 12100, THEN initial upside estimate targets 12175 – 12215 zone.
Bear Scenario: IF Bears sustain an offer below 12100, THEN initial downside estimate targets 12062 – 12020 zone.
PVA High Edge = 11979 PVA Low Edge = 11776 Prior POC = 11945
Range Projections and Key Levels (NQ) June 2022 (M) Contract
HOD ATR Range Projection: 12411; LOD ATR Range Projection: 11660; 3 Day Central Pivot: 12131; 3 Day Cycle Target: 12206; 10 Day Average True Range: 520; VIX: 30
Trade Strategy: Our tactical trade strategy will simply remain unaltered…We’ll be flexible to trade both long and short side from Decision Pivot Levels. Continue to focus on Bull/Bear Stackers and Premium/Discounts. As always, remaining in alignment with dominant intra-day force increases probabilities of producing winning trades.
Stay Focused…Non-Biased…Disciplined ALWAYS USE STOPS!
Good Trading…David
“Knowing is not enough, We must APPLY. Willing is not enough, We must DO.” –Bruce Lee
*****This trade strategy report is disseminated for “education only” and should not be viewed in any way as a recommendation to buy or sell futures products.”
PAST PERFORMANCE IS NOT NECESSARILY INDICATIVE OF FUTURE RESULTS
IMPORTANT NOTICE! No representation is being made that the use of this strategy or any system or trading methodology will generate profits. Past performance is not necessarily indicative of future results. There is substantial risk of loss associated with trading securities and options on equities. Only risk capital should be used to trade. Trading securities is not suitable for everyone.
Disclaimer: Futures, Options, and Currency trading all have large potential rewards, but they also have large potential risk. You must be aware of the risks and be willing to accept them in order to invest in these markets. Don’t trade with money you can’t afford to lose.
This website is neither a solicitation nor an offer to Buy/Sell futures, options, or currencies. No representation is being made that any account will or is likely to achieve profits or losses similar to those discussed on this web site. The past performance of any trading system or methodology is not necessarily indicative of future results.
CFTC RULE 4.41 –HYPOTHETICAL OR SIMULATED PERFORMANCE RESULTS HAVE CERTAIN LIMITATIONS. UNLIKE AN ACTUAL PERFORMANCE RECORD, SIMULATED RESULTS DO NOT REPRESENT ACTUAL TRADING. ALSO, SINCE THE TRADES HAVE NOT BEEN EXECUTED, THE RESULTS MAY HAVE UNDER-OR-OVER COMPENSATED FOR THE IMPACT, IF ANY, OF CERTAIN MARKET FACTORS, SUCH AS LACK OF LIQUIDITY. SIMULATED TRADING PROGRAMS IN GENERAL ARE ALSO SUBJECT TO THE FACT THAT THEY ARE DESIGNED WITH THE BENEFIT OF HINDSIGHT. NO REPRESENTATION IS BEING MADE THAT ANY ACCOUNT WILL OR IS LIKELY TO ACHIEVE PROFIT OR LOSSES SIMILAR TO THOSE SHOWN