
Markets (Top Stories)
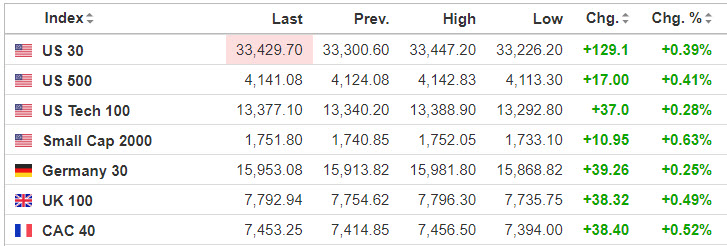
Source: http://seekingalpha.com
Economic Calendar
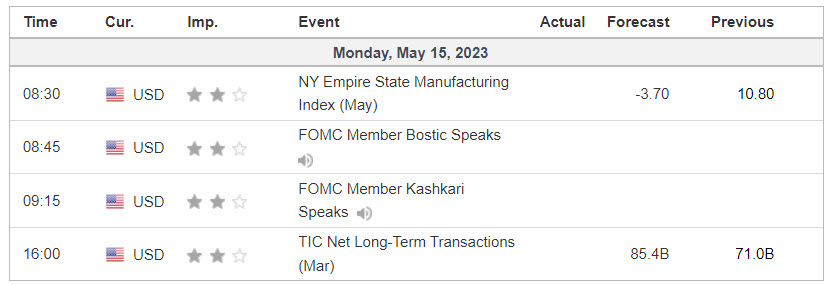
https://www.investing.com/economic-calendar/
S&P 500

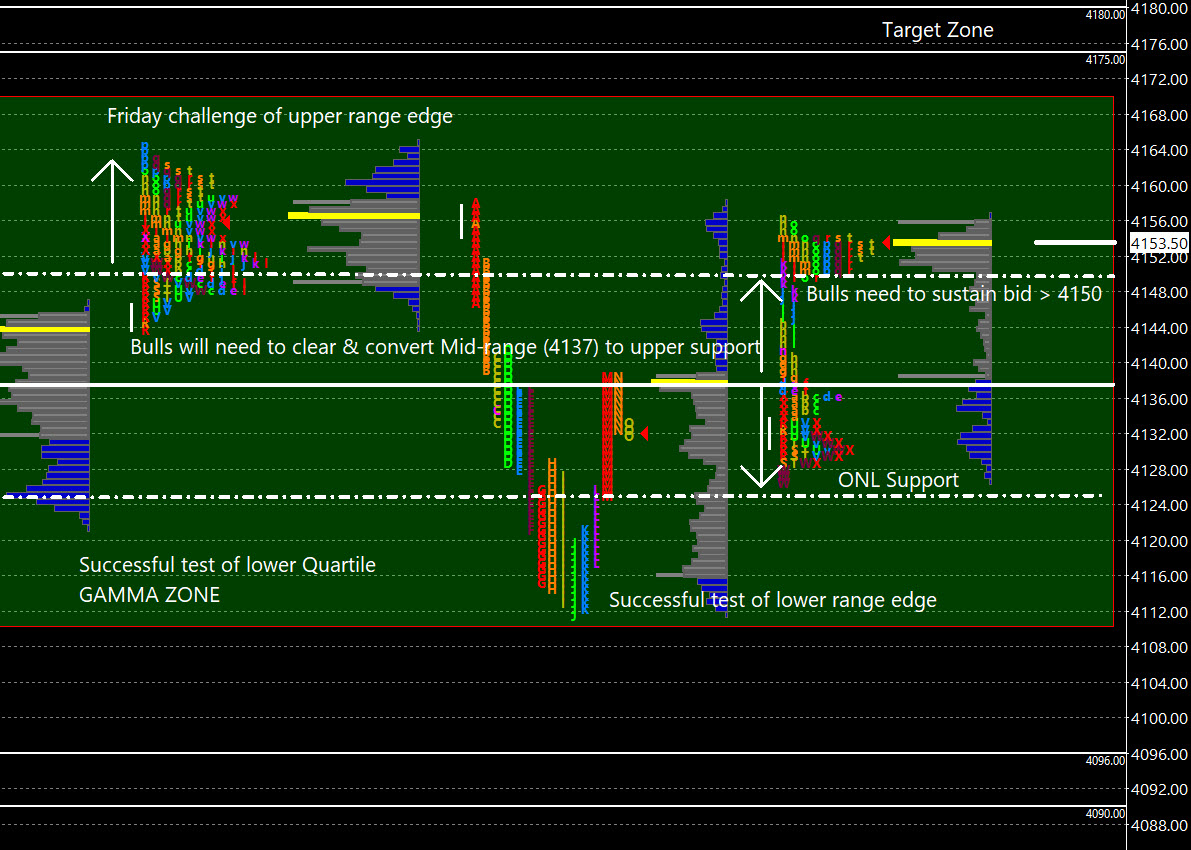
Prior Session was Cycle Day 1 (CD1): Normal CD1 as price declined establishing new cycle low at 4111.75 (CD1 projected Average Decline measured 4113.50 per DTS 0512.23). Prior range was 52 handles on 1.385M contracts exchanged.
…Transition from Cycle Day 1 to Cycle Day 2
This leads us into Cycle Day 2 (CD2): Price has fulfilled initial cycle objective (4152) during overnight activity, as well as TargetMaster Breakout Level 1. Bulls will need to hold bid at or above 4150 for a continued push to 4175 – 80 target zone. Failure to expand keeps price within 5-day value. As such, estimated scenarios to consider for today’s trading.
Bull Scenario: Price sustains a bid above 4150, initially targets 4165 – 4170 zone.
Bear Scenario: Price sustains an offer below 4150, initially targets 4135 – 4130 zone.
PVA High Edge = 4145 PVA Low Edge = 4117 Prior POC 4137
Range Projections and Key Levels (ES) June 2023 (M) Contract
HOD ATR Range Projection: 4180; LOD ATR Range Projection: 4103; 3 Day Central Pivot: 4145; 3 Day Cycle Target: 4152; 10 Day Average True Range 53; VIX: 17
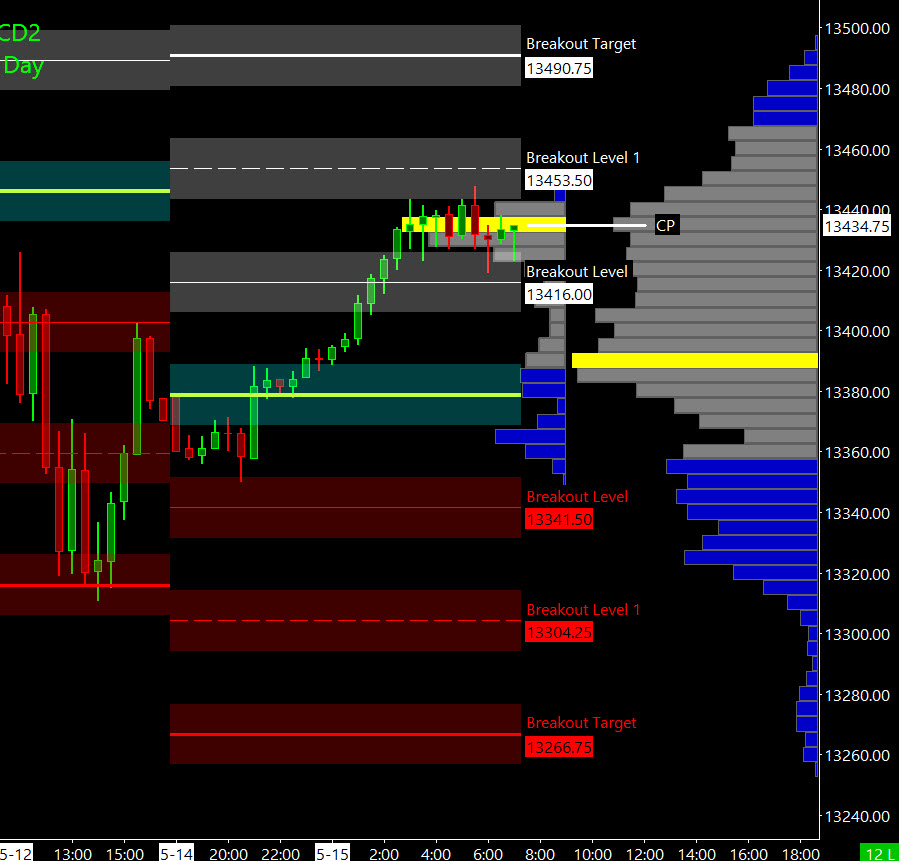
Nasdaq 100 (NQ)

Prior Session was Cycle Day 1 (CD1): Normal CD1 as price declined establishing new cycle low at 13310. Prior range was 184 handles on 618k contracts exchanged.
…Transition from Cycle Day 1 to Cycle Day 2
This leads us into Cycle Day 2 (CD2): Price is trading near upper edge of 5 day range during overnight activity. Bulls will need to sustain bid for a continuation push higher, otherwise, reversion lower to remain rangebound. As such, estimated scenarios to consider for today’s trading.
Bull Scenario: IF Bulls sustains bid above 13445, THEN initial upside estimate targets 13380– 13390 zone.
Bear Scenario: IF Bears sustains offer below 13445, THEN initial downside estimate targets 13390 – 13380 zone.
PVA High Edge = 13424 PVA Low Edge = 13324 Prior POC = 13396
Range Projections and Key Levels (NQ) June 2022 (M) Contract
HOD ATR Range Projection: 13530; LOD ATR Range Projection: 13266; 3 Day Central Pivot: 13390; 3 Day Cycle Target: 13575; 10 Day Average True Range: 180; VIX: 17
Trade Strategy: Our tactical trade strategy will simply remain unaltered…We’ll be flexible to trade both long and short side from Decision Pivot Levels. Continue to focus on Bull/Bear Stackers and Premium/Discounts. As always, remaining in alignment with dominant intra-day force increases probabilities of producing winning trades.
Stay Focused…Non-Biased…Disciplined ALWAYS USE STOPS!
Good Trading…David
“Knowing is not enough, We must APPLY. Willing is not enough, We must DO.” –Bruce Lee
*****This trade strategy report is disseminated for “education only” and should not be viewed in any way as a recommendation to buy or sell futures products.”
PAST PERFORMANCE IS NOT NECESSARILY INDICATIVE OF FUTURE RESULTS
IMPORTANT NOTICE! No representation is being made that the use of this strategy or any system or trading methodology will generate profits. Past performance is not necessarily indicative of future results. There is substantial risk of loss associated with trading securities and options on equities. Only risk capital should be used to trade. Trading securities is not suitable for everyone.
Disclaimer: Futures, Options, and Currency trading all have large potential rewards, but they also have large potential risk. You must be aware of the risks and be willing to accept them in order to invest in these markets. Don’t trade with money you can’t afford to lose.
This website is neither a solicitation nor an offer to Buy/Sell futures, options, or currencies. No representation is being made that any account will or is likely to achieve profits or losses similar to those discussed on this web site. The past performance of any trading system or methodology is not necessarily indicative of future results.
CFTC RULE 4.41 –HYPOTHETICAL OR SIMULATED PERFORMANCE RESULTS HAVE CERTAIN LIMITATIONS. UNLIKE AN ACTUAL PERFORMANCE RECORD, SIMULATED RESULTS DO NOT REPRESENT ACTUAL TRADING. ALSO, SINCE THE TRADES HAVE NOT BEEN EXECUTED, THE RESULTS MAY HAVE UNDER-OR-OVER COMPENSATED FOR THE IMPACT, IF ANY, OF CERTAIN MARKET FACTORS, SUCH AS LACK OF LIQUIDITY. SIMULATED TRADING PROGRAMS IN GENERAL ARE ALSO SUBJECT TO THE FACT THAT THEY ARE DESIGNED WITH THE BENEFIT OF HINDSIGHT. NO REPRESENTATION IS BEING MADE THAT ANY ACCOUNT WILL OR IS LIKELY TO ACHIEVE PROFIT OR LOSSES SIMILAR TO THOSE SHOWN