
Markets
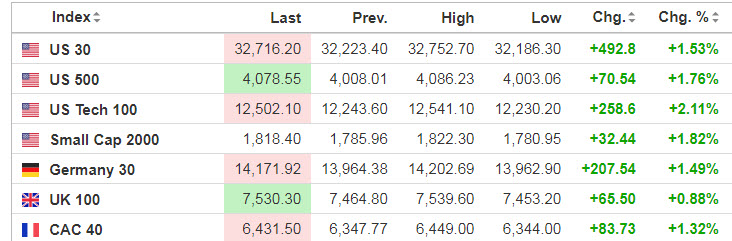
Economic Calendar
8:30 Retail Sales
9:15 Industrial Production
9:15 Fed’s Harker: “Healthcare as an Economic Driver”
10:00 Business Inventories
10:00 NAHB Housing Market Index
2:00 PM Jerome Powell Speech
https://www.investing.com/economic-calendar/
***New: PTG Trading Room Chat Log’s Link
S&P 500

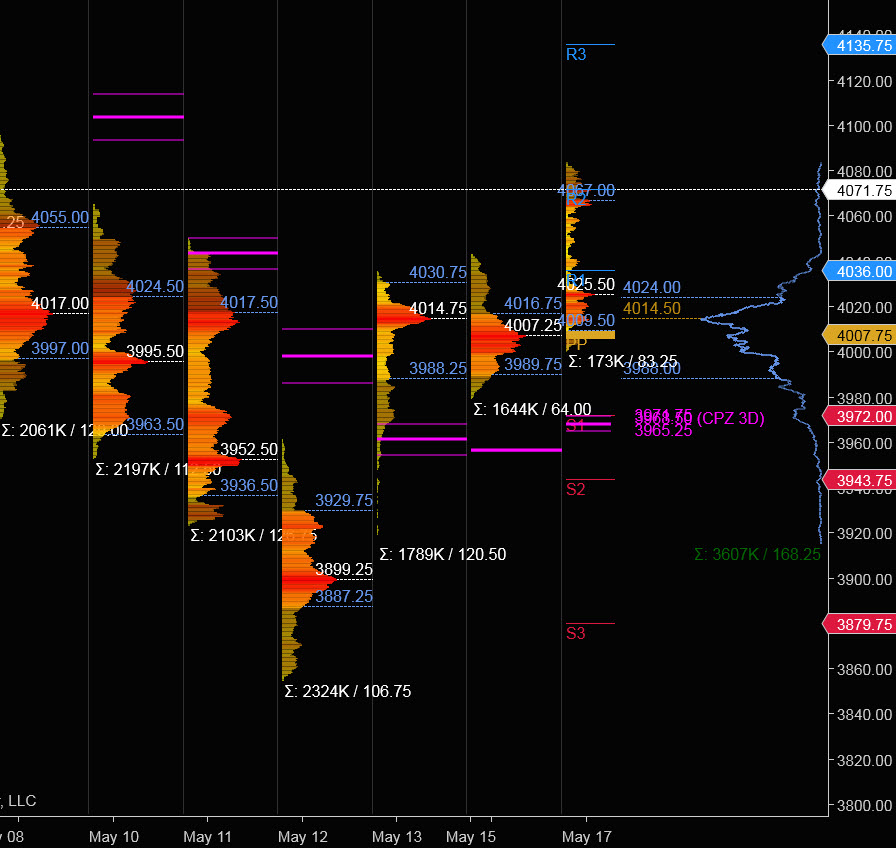
Prior Session was Cycle Day 3 (CD3): Market’s price action was “neutral-bullish” as price consolidated within Friday’s Value Area. Prior range was scant 64 handles on 1.644M contracts exchanged.
…Transition from Cycle Day 3 to Cycle Day 1
This leads us into Cycle Day 1 (CD1): Today begins a new cycle, with the Average Decline measuring 3929. Market found some firm footing during prior session and is currently building on that action, as price is higher pre-RTH. Bulls will need to continue to build higher value, otherwise this could turn out to be another “fizzle-stick” attempt. As such, estimated scenarios to consider for today’s trading.
Bull Scenario: Price sustains a bid above 4044, initially targets 4077 – 4086 zone.
Bear Scenario: Price sustains an offer below 4044, initially targets 40.26 – 4015 zone.
*****3 Day Cycle has a 91% probability of fulfilling Positive Cycle Statistics covering 12 years of recorded tracking history.
PVA High Edge = 4017 PVA Low Edge = 3990 Prior POC = 4007
Range Projections and Key Levels (ES) June 2022 (M) Contract
HOD ATR Range Projection: 4120; LOD ATR Range Projection: 3964; 3 Day Central Pivot: 3968; 3 Day Cycle Target: 4120; 10 Day Average True Range; 120; VIX: 27
Nasdaq 100 (NQ)

Today is Cycle Day 1 (CD1)…Average Decline for CD1 measures 11966 for this cycle day. Price is currently trading at PH (12498). As such, there are two estimated scenarios to consider for today’s trading.
Bull Scenario: IF Bulls sustain a bid above 12498, THEN initial upside estimate targets 12585 – 12650 zone.
Bear Scenario: IF Bears sustain an offer below 12498, THEN initial downside estimate targets 12390– 12325 zone.
PVA High Edge = 12330 PVA Low Edge = 12227 Prior POC = 12243
Range Projections and Key Levels (NQ) June 2022 (M) Contract
HOD ATR Range Projection: 12739; LOD ATR Range Projection: 12038; 3 Day Central Pivot: 12145; 3 Day Cycle Target: 12768; 10 Day Average True Range: 505; VIX: 27

Trade Strategy: Our tactical trade strategy will simply remain unaltered…We’ll be flexible to trade both long and short side from Decision Pivot Levels. Continue to focus on Bull/Bear Stackers and Premium/Discounts. As always, remaining in alignment with dominant intra-day force increases probabilities of producing winning trades.
Stay Focused…Non-Biased…Disciplined ALWAYS USE STOPS!
Good Trading…David
“Knowing is not enough, We must APPLY. Willing is not enough, We must DO.” –Bruce Lee
*****This trade strategy report is disseminated for “education only” and should not be viewed in any way as a recommendation to buy or sell futures products.”
PAST PERFORMANCE IS NOT NECESSARILY INDICATIVE OF FUTURE RESULTS
IMPORTANT NOTICE! No representation is being made that the use of this strategy or any system or trading methodology will generate profits. Past performance is not necessarily indicative of future results. There is substantial risk of loss associated with trading securities and options on equities. Only risk capital should be used to trade. Trading securities is not suitable for everyone.
Disclaimer: Futures, Options, and Currency trading all have large potential rewards, but they also have large potential risk. You must be aware of the risks and be willing to accept them in order to invest in these markets. Don’t trade with money you can’t afford to lose.
This website is neither a solicitation nor an offer to Buy/Sell futures, options, or currencies. No representation is being made that any account will or is likely to achieve profits or losses similar to those discussed on this web site. The past performance of any trading system or methodology is not necessarily indicative of future results.
CFTC RULE 4.41 –HYPOTHETICAL OR SIMULATED PERFORMANCE RESULTS HAVE CERTAIN LIMITATIONS. UNLIKE AN ACTUAL PERFORMANCE RECORD, SIMULATED RESULTS DO NOT REPRESENT ACTUAL TRADING. ALSO, SINCE THE TRADES HAVE NOT BEEN EXECUTED, THE RESULTS MAY HAVE UNDER-OR-OVER COMPENSATED FOR THE IMPACT, IF ANY, OF CERTAIN MARKET FACTORS, SUCH AS LACK OF LIQUIDITY. SIMULATED TRADING PROGRAMS IN GENERAL ARE ALSO SUBJECT TO THE FACT THAT THEY ARE DESIGNED WITH THE BENEFIT OF HINDSIGHT. NO REPRESENTATION IS BEING MADE THAT ANY ACCOUNT WILL OR IS LIKELY TO ACHIEVE PROFIT OR LOSSES SIMILAR TO THOSE SHOWN