
Markets
“The Fed hasn’t run out of ammunition by a long shot,” Jay Powell said in an interview last night on CBS’s 60 Minutes. “There’s really no limit to what we can do in lending programs.” S&P 500 futures climbed 1.5% on the news, while oil soared 5% to top $30 per barrel for the first time in a couple of months.
Source: SeekingAlpha.com
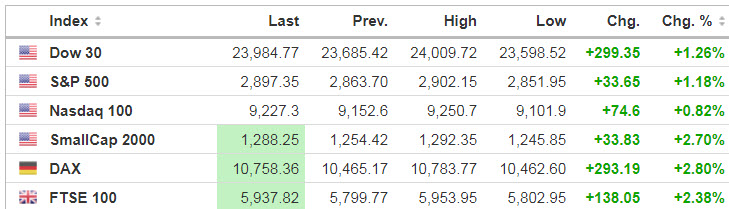
Source: https://www.investing.com/indices/indices-cfds
Economic Calendar
10:00 NAHB Housing Market Index
https://www.investing.com/economic-calendar/
***New: PTG Trading Room Chat Log’s Link
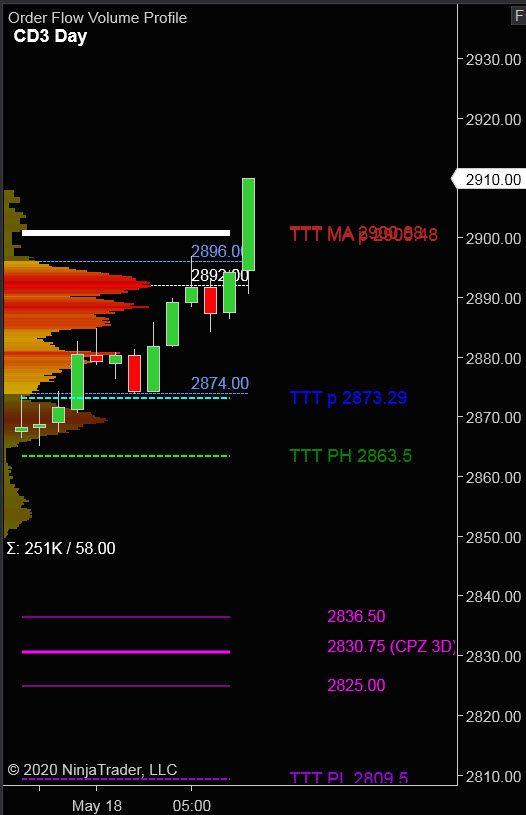
S&P 500
Friday’s Session was Cycle Day 2 (CD2): Normal CD2 Day unfolded as price established an early range with a bullish skew, then pushed higher closing near high of day.
…Transition from Cycle Day 2 to Cycle Day 3
This leads us into Cycle Day 3 (CD3): Having closed near high of session price has extended this cycle’s rally past the Penetration Levels and fulfilled the 3 Day Average Cycle Rally Target of 2900 – 2904 zone.
*****3 Day Cycle has a 91% probability of fulfilling Positive Statistic covering 12 years of recorded tracking history.
PVA High Edge = 2860 PVA Low Edge = 2829 Prior POC = 2844
Bull Scenario: IF Bulls hold bid above 2890, THEN initial upside estimate targets 2900 – 2905 zone.
Bear Scenario: IF Bears hold offer below 2890, THEN initial downside estimate targets 2880 – 2875 zone.
Range Projections and Key Levels (ES) June 2020 (M) Contract
HOD ATR Range Projection: 2909; LOD ATR Range Projection: 2838; 3 Day Central Pivot: 2830; 3 Day Cycle Target: 2900; 10 Day Average True Range 70.00; VIX: 30.00
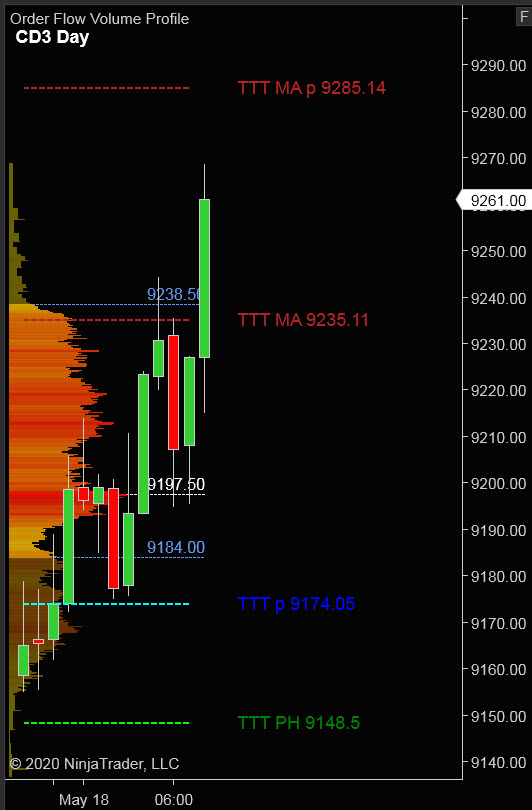
Nasdaq 100 (NQ)
Today is Cycle Day 3 (CD3)…Price has fulfilled Positive 3 Day Cycle Statistic and fulfilled Average 3 Day Cycle Rally Target of 9235. Bullish momentum is firmly entrenched above prior high (9148.50)
PVA High Edge = 9133 PVA Low Edge = 8993 Prior POC = 9103
Bull Scenario: IF Bulls hold bid above 9225, THEN initial upside estimate targets 9250 – 9265 zone.
Bear Scenario: IF Bears hold offer below 9225, THEN initial downside estimate targets 9225 – 9200 zone.
Range Projections and Key Levels (NQ) June 2020 (M) Contract
HOD ATR Range Projection: 9306; LOD ATR Range Projection: 9060; 3 Day Central Pivot: 9036; 3 Day Cycle Target: 9235; 10 Day Average True Range: 230; VIX: 30.00
Trade Strategy: Our tactical trade strategy will simply remain unaltered…We’ll be flexible to trade both long and short side from Decision Pivot Levels. Continue to focus on Bull/Bear Stackers and Premium/Discounts. As always, remaining in alignment with dominant intra-day force increases probabilities of producing winning trades.
Stay Focused…Non-Biased…Disciplined ALWAYS USE STOPS!
Good Trading…David
“Knowing is not enough, We must APPLY. Willing is not enough, We must DO.” –Bruce Lee
*****This trade strategy report is disseminated for “education only” and should not be viewed in any way as a recommendation to buy or sell futures products.”
PAST PERFORMANCE IS NOT NECESSARILY INDICATIVE OF FUTURE RESULTS
IMPORTANT NOTICE! No representation is being made that the use of this strategy or any system or trading methodology will generate profits. Past performance is not necessarily indicative of future results. There is substantial risk of loss associated with trading securities and options on equities. Only risk capital should be used to trade. Trading securities is not suitable for everyone.
Disclaimer: Futures, Options, and Currency trading all have large potential rewards, but they also have large potential risk. You must be aware of the risks and be willing to accept them in order to invest in these markets. Don’t trade with money you can’t afford to lose.
This website is neither a solicitation nor an offer to Buy/Sell futures, options, or currencies. No representation is being made that any account will or is likely to achieve profits or losses similar to those discussed on this web site. The past performance of any trading system or methodology is not necessarily indicative of future results.
CFTC RULE 4.41 –HYPOTHETICAL OR SIMULATED PERFORMANCE RESULTS HAVE CERTAIN LIMITATIONS. UNLIKE AN ACTUAL PERFORMANCE RECORD, SIMULATED RESULTS DO NOT REPRESENT ACTUAL TRADING. ALSO, SINCE THE TRADES HAVE NOT BEEN EXECUTED, THE RESULTS MAY HAVE UNDER-OR-OVER COMPENSATED FOR THE IMPACT, IF ANY, OF CERTAIN MARKET FACTORS, SUCH AS LACK OF LIQUIDITY. SIMULATED TRADING PROGRAMS IN GENERAL ARE ALSO SUBJECT TO THE FACT THAT THEY ARE DESIGNED WITH THE BENEFIT OF HINDSIGHT. NO REPRESENTATION IS BEING MADE THAT ANY ACCOUNT WILL OR IS LIKELY TO ACHIEVE PROFIT OR LOSSES SIMILAR TO THOSE SHOWN