
Markets
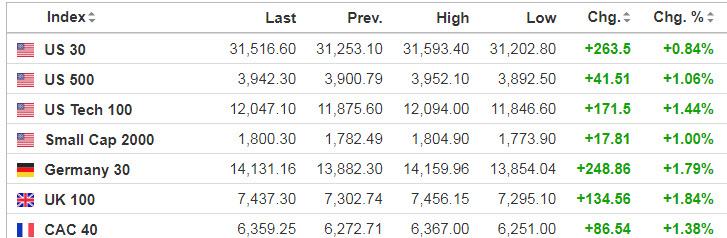
While stocks are trying to grab back some gains this morning, the S&P 500 fell even closer to a bear market on Thursday, now down 18.6% from its record closing high set in early January. If things turn around again this session, there is a good chance the benchmark could fall into bear territory for the first time since 2007 (barring the month-long freakout that occurred in March 2020).
Economic Calendar
10:00 Quarterly Services Report
1:00 PM Baker-Hughes Rig Count
https://www.investing.com/economic-calendar/
***New: PTG Trading Room Chat Log’s Link
S&P 500

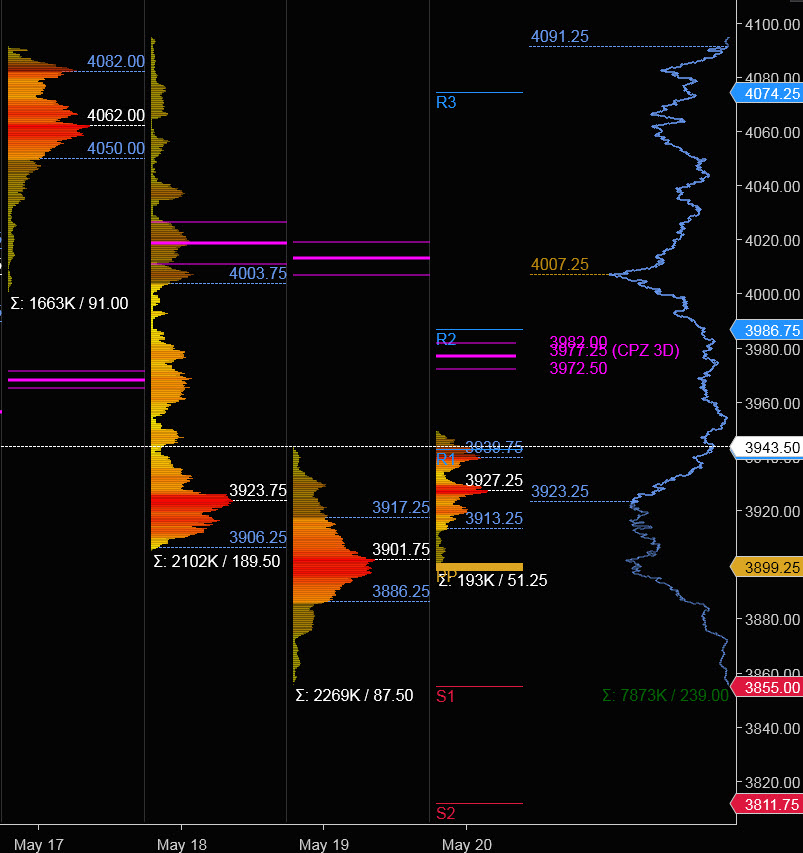
Prior Session was Cycle Day 3 (CD3): Market’s failed to recover CD1 Low, securing the 9% statistic as price consolidated throughout the session in a Balancing Day. Prior range was 87.50 handles on 2.269M contracts exchanged.
…Transition from Cycle Day 3 to Cycle Day 1
This leads us into Cycle Day 1 (CD1): Today begins a new cycle, with the Average Decline measuring 3833. Bulls do have a shot to negate the failed cycle with a “grace-day” today as OPEX is expected to be the driver for the session. As such, estimated scenarios to consider for today’s trading.
Bull Scenario: Price sustains a bid above 3940, initially targets 3962 – 3978 zone.
Bear Scenario: Price sustains an offer below 3940, initially targets 3925 – 3917 zone.
*****3 Day Cycle has a 91% probability of fulfilling Positive Cycle Statistics covering 12 years of recorded tracking history.
PVA High Edge = 3917 PVA Low Edge = 3886 Prior POC = 3902
Range Projections and Key Levels (ES) June 2022 (M) Contract
HOD ATR Range Projection: 4012; LOD ATR Range Projection: 3835; 3 Day Central Pivot: 3977; 3 Day Cycle Target: 4000; 10 Day Average True Range; 114; VIX: 28
Nasdaq 100 (NQ)

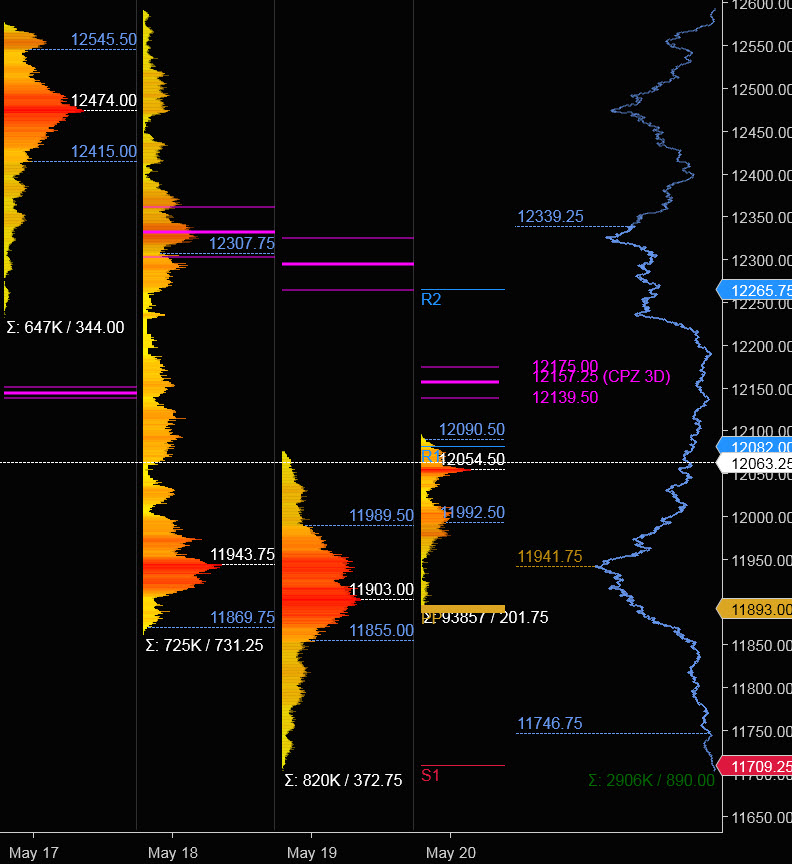
Today is Cycle Day 1 (CD1)…Average Decline for CD1 measures 11966 for this cycle day. Bulls have a possible opening being OPEX to recover CD1 Low (12234). As such, there are two estimated scenarios to consider for today’s trading.
Bull Scenario: IF Bulls sustain a bid above 12077, THEN initial upside estimate targets 12134 – 12157 zone.
Bear Scenario: IF Bears sustain an offer below 12077, THEN initial downside estimate targets 11990– 11955 zone.
PVA High Edge = 11990 PVA Low Edge = 11855 Prior POC = 11903
Range Projections and Key Levels (NQ) June 2022 (M) Contract
HOD ATR Range Projection: 12372; LOD ATR Range Projection: 11619; 3 Day Central Pivot: 12157; 3 Day Cycle Target: 12234; 10 Day Average True Range: 477; VIX: 28
Trade Strategy: Our tactical trade strategy will simply remain unaltered…We’ll be flexible to trade both long and short side from Decision Pivot Levels. Continue to focus on Bull/Bear Stackers and Premium/Discounts. As always, remaining in alignment with dominant intra-day force increases probabilities of producing winning trades.
Stay Focused…Non-Biased…Disciplined ALWAYS USE STOPS!
Good Trading…David
“Knowing is not enough, We must APPLY. Willing is not enough, We must DO.” –Bruce Lee
*****This trade strategy report is disseminated for “education only” and should not be viewed in any way as a recommendation to buy or sell futures products.”
PAST PERFORMANCE IS NOT NECESSARILY INDICATIVE OF FUTURE RESULTS
IMPORTANT NOTICE! No representation is being made that the use of this strategy or any system or trading methodology will generate profits. Past performance is not necessarily indicative of future results. There is substantial risk of loss associated with trading securities and options on equities. Only risk capital should be used to trade. Trading securities is not suitable for everyone.
Disclaimer: Futures, Options, and Currency trading all have large potential rewards, but they also have large potential risk. You must be aware of the risks and be willing to accept them in order to invest in these markets. Don’t trade with money you can’t afford to lose.
This website is neither a solicitation nor an offer to Buy/Sell futures, options, or currencies. No representation is being made that any account will or is likely to achieve profits or losses similar to those discussed on this web site. The past performance of any trading system or methodology is not necessarily indicative of future results.
CFTC RULE 4.41 –HYPOTHETICAL OR SIMULATED PERFORMANCE RESULTS HAVE CERTAIN LIMITATIONS. UNLIKE AN ACTUAL PERFORMANCE RECORD, SIMULATED RESULTS DO NOT REPRESENT ACTUAL TRADING. ALSO, SINCE THE TRADES HAVE NOT BEEN EXECUTED, THE RESULTS MAY HAVE UNDER-OR-OVER COMPENSATED FOR THE IMPACT, IF ANY, OF CERTAIN MARKET FACTORS, SUCH AS LACK OF LIQUIDITY. SIMULATED TRADING PROGRAMS IN GENERAL ARE ALSO SUBJECT TO THE FACT THAT THEY ARE DESIGNED WITH THE BENEFIT OF HINDSIGHT. NO REPRESENTATION IS BEING MADE THAT ANY ACCOUNT WILL OR IS LIKELY TO ACHIEVE PROFIT OR LOSSES SIMILAR TO THOSE SHOWN