
Markets
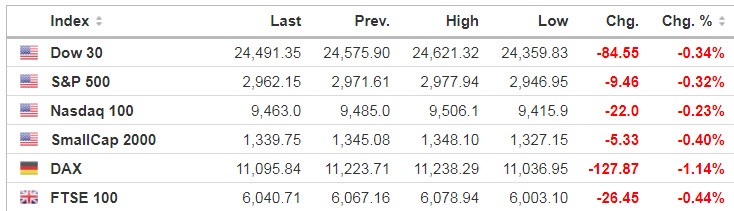
Source: https://www.investing.com/indices/indices-cfds
In U.S. economic news, today’s weekly jobless claims could offer some early clues on how quickly businesses rehire workers and the success of the Paycheck Protection Program.

Source: SeekingAlpha.com
Economic Calendar
8:30 Initial Jobless Claims
8:30 Philly Fed Business Outlook
9:45 PMI Composite Flash
10:00 Fed’s Williams Speech
10:00 Existing Home Sales
10:00 Leading Indicators
10:30 EIA Natural Gas Inventory
https://www.investing.com/economic-calendar/
***New: PTG Trading Room Chat Log’s Link
S&P 500
Prior Session was Cycle Day 2 (CD2): Normal CD2 Day unfolded as price consolidated previous session’s rally gains. Textbook Cycle Day 2.
…Transition from Cycle Day 2 to Cycle Day 3
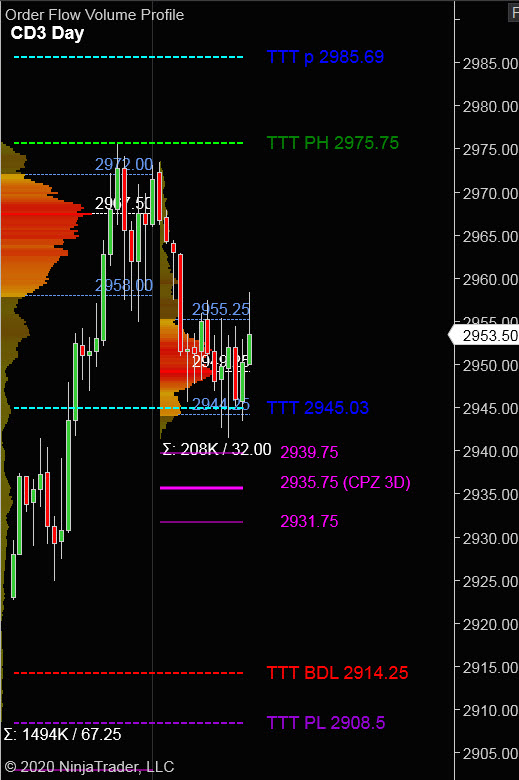
This leads us into Cycle Day 3 (CD3): Having fulfilled cycle objectives, bullish bias remains intact as additional back and fill may continue. We’ll mark today as a “wild-card” with wide range of price level potential. Marking 2945 buy response and 2965 sell response edges.
*****3 Day Cycle has a 91% probability of fulfilling Positive Statistic covering 12 years of recorded tracking history.
PVA High Edge = 2972 PVA Low Edge = 2958 Prior POC = 2968
Bull Scenario: IF Bulls hold bid above 2958, THEN initial upside estimate targets 2965 – 2975 zone.
Bear Scenario: IF Bears hold offer below 2958, THEN initial downside estimate targets 2945 – 2940 zone.
Range Projections and Key Levels (ES) June 2020 (M) Contract
HOD ATR Range Projection: 2994; LOD ATR Range Projection: 2921; 3 Day Central Pivot: 2936; 3 Day Cycle Target: 2945; 10 Day Average True Range 68.00; VIX: 28.50
Nasdaq 100 (NQ)
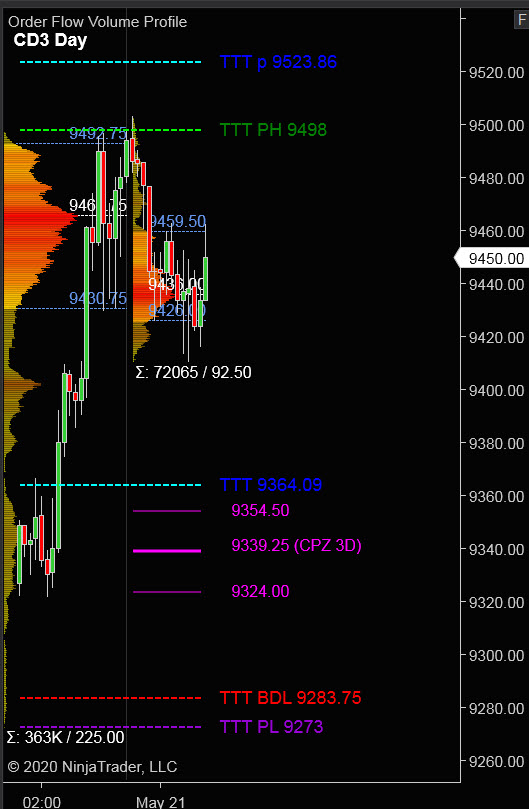
Today is Cycle Day 3 (CD3)…Price has fulfilled Positive 3 Day Cycle Statistic and fulfilled Average 3 Day Cycle Rally Target of 9364. Bullish momentum is firmly entrenched with support marked at 9420 handle.
PVA High Edge = 9493 PVA Low Edge = 9430 Prior POC = 9466
Bull Scenario: IF Bulls hold bid above 9460, THEN initial upside estimate targets 9475 – 9485 zone.
Bear Scenario: IF Bears hold offer below 9460, THEN initial downside estimate targets 9450 – 9440 zone.
Range Projections and Key Levels (NQ) June 2020 (M) Contract
HOD ATR Range Projection: 9561; LOD ATR Range Projection: 9353; 3 Day Central Pivot: 9339; 3 Day Cycle Target: 9364; 10 Day Average True Range: 203; VIX: 28.50
Trade Strategy: Our tactical trade strategy will simply remain unaltered…We’ll be flexible to trade both long and short side from Decision Pivot Levels. Continue to focus on Bull/Bear Stackers and Premium/Discounts. As always, remaining in alignment with dominant intra-day force increases probabilities of producing winning trades.
Stay Focused…Non-Biased…Disciplined ALWAYS USE STOPS!
Good Trading…David
“Knowing is not enough, We must APPLY. Willing is not enough, We must DO.” –Bruce Lee
*****This trade strategy report is disseminated for “education only” and should not be viewed in any way as a recommendation to buy or sell futures products.”
PAST PERFORMANCE IS NOT NECESSARILY INDICATIVE OF FUTURE RESULTS
IMPORTANT NOTICE! No representation is being made that the use of this strategy or any system or trading methodology will generate profits. Past performance is not necessarily indicative of future results. There is substantial risk of loss associated with trading securities and options on equities. Only risk capital should be used to trade. Trading securities is not suitable for everyone.
Disclaimer: Futures, Options, and Currency trading all have large potential rewards, but they also have large potential risk. You must be aware of the risks and be willing to accept them in order to invest in these markets. Don’t trade with money you can’t afford to lose.
This website is neither a solicitation nor an offer to Buy/Sell futures, options, or currencies. No representation is being made that any account will or is likely to achieve profits or losses similar to those discussed on this web site. The past performance of any trading system or methodology is not necessarily indicative of future results.
CFTC RULE 4.41 –HYPOTHETICAL OR SIMULATED PERFORMANCE RESULTS HAVE CERTAIN LIMITATIONS. UNLIKE AN ACTUAL PERFORMANCE RECORD, SIMULATED RESULTS DO NOT REPRESENT ACTUAL TRADING. ALSO, SINCE THE TRADES HAVE NOT BEEN EXECUTED, THE RESULTS MAY HAVE UNDER-OR-OVER COMPENSATED FOR THE IMPACT, IF ANY, OF CERTAIN MARKET FACTORS, SUCH AS LACK OF LIQUIDITY. SIMULATED TRADING PROGRAMS IN GENERAL ARE ALSO SUBJECT TO THE FACT THAT THEY ARE DESIGNED WITH THE BENEFIT OF HINDSIGHT. NO REPRESENTATION IS BEING MADE THAT ANY ACCOUNT WILL OR IS LIKELY TO ACHIEVE PROFIT OR LOSSES SIMILAR TO THOSE SHOWN