
Markets
U.S. stock index futures soared 2% overnight, suggesting the S&P 500 will open above its 200-day moving average as trading resumes after Memorial Day.
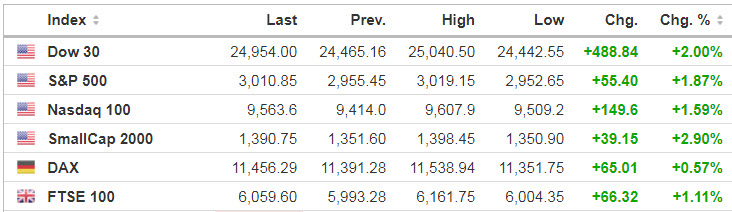
Source: https://www.investing.com/indices/indices-cfds
Source: SeekingAlpha.com
Economic Calendar
8:30 Chicago Fed National Activity Index
9:00 S&P Corelogic Case-Shiller Home Price Index
9:00 FHFA House Price Index
10:00 Consumer Confidence
10:00 New Home Sales
https://www.investing.com/economic-calendar/
***New: PTG Trading Room Chat Log’s Link
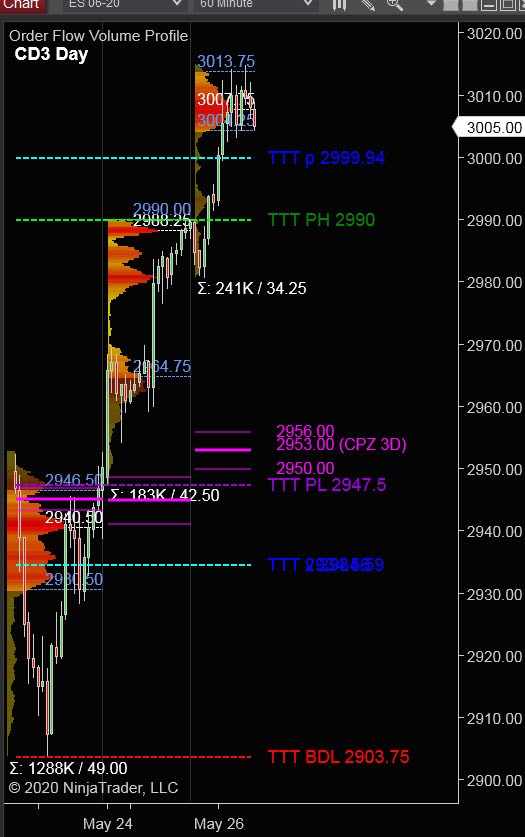
S&P 500
Prior Session was Cycle Day 2 (CD2): Shortened Holiday trade Session saw price continue this cycle’s rally closing 2 tics off high of day.
…Transition from Cycle Day 2 to Cycle Day 3
This leads us into Cycle Day 3 (CD3): As markets re-open following long holiday weekend, price has continued to push above CD2 High (2990) fulfilling upside objectives. This cycle’s range is in excess of 111 handles.
*****3 Day Cycle has a 91% probability of fulfilling Positive Statistic covering 12 years of recorded tracking history.
PVA High Edge = 3014 PVA Low Edge = 3004 Prior POC = 3008
Bull Scenario: IF Bulls hold bid above 3008, THEN initial upside estimate targets 3014 – 3016 zone.
Bear Scenario: IF Bears hold offer below 3008, THEN initial downside estimate targets 3000 – 2995 zone.
Range Projections and Key Levels (ES) June 2020 (M) Contract
HOD ATR Range Projection: 3022; LOD ATR Range Projection: 2974; 3 Day Central Pivot: 2954; 3 Day Cycle Target: 2935; 10 Day Average True Range 57; VIX: 28.00
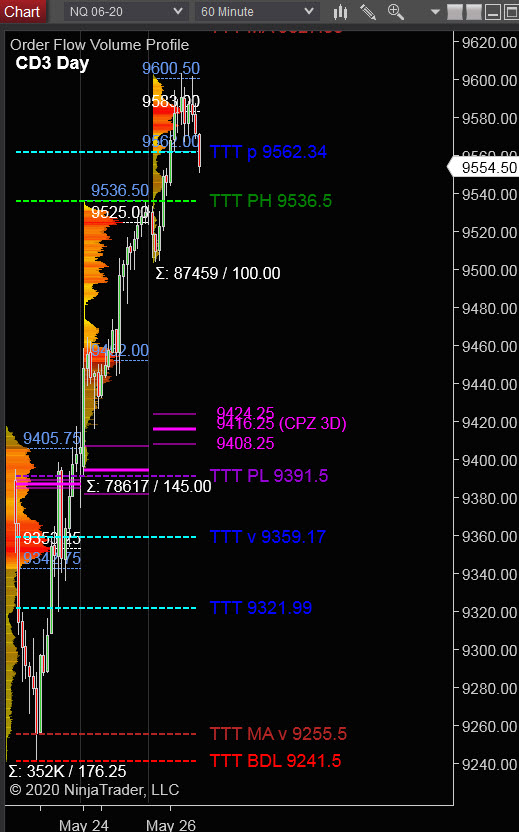
Nasdaq 100 (NQ)
Today is Cycle Day 3 (CD3)…Price has fulfilled Positive 3 Day Cycle Statistic and fulfilled Average 3 Day Cycle Rally Target of 9322. This cycle rally’s range is in excess of 363 handles.
PVA High Edge = 9600 PVA Low Edge = 9562 Prior POC = 9583
Bull Scenario: IF Bulls hold bid above 9583, THEN initial upside estimate targets 9595 – 9600 zone.
Bear Scenario: IF Bears hold offer below 9583, THEN initial downside estimate targets 9550 – 9540 zone.
Range Projections and Key Levels (NQ) June 2020 (M) Contract
HOD ATR Range Projection: 9635; LOD ATR Range Projection: 9472; 3 Day Central Pivot: 9418; 3 Day Cycle Target: 9322; 10 Day Average True Range: 180; VIX: 28.00
Trade Strategy: Our tactical trade strategy will simply remain unaltered…We’ll be flexible to trade both long and short side from Decision Pivot Levels. Continue to focus on Bull/Bear Stackers and Premium/Discounts. As always, remaining in alignment with dominant intra-day force increases probabilities of producing winning trades.
Stay Focused…Non-Biased…Disciplined ALWAYS USE STOPS!
Good Trading…David
“Knowing is not enough, We must APPLY. Willing is not enough, We must DO.” –Bruce Lee
*****This trade strategy report is disseminated for “education only” and should not be viewed in any way as a recommendation to buy or sell futures products.”
PAST PERFORMANCE IS NOT NECESSARILY INDICATIVE OF FUTURE RESULTS
IMPORTANT NOTICE! No representation is being made that the use of this strategy or any system or trading methodology will generate profits. Past performance is not necessarily indicative of future results. There is substantial risk of loss associated with trading securities and options on equities. Only risk capital should be used to trade. Trading securities is not suitable for everyone.
Disclaimer: Futures, Options, and Currency trading all have large potential rewards, but they also have large potential risk. You must be aware of the risks and be willing to accept them in order to invest in these markets. Don’t trade with money you can’t afford to lose.
This website is neither a solicitation nor an offer to Buy/Sell futures, options, or currencies. No representation is being made that any account will or is likely to achieve profits or losses similar to those discussed on this web site. The past performance of any trading system or methodology is not necessarily indicative of future results.
CFTC RULE 4.41 –HYPOTHETICAL OR SIMULATED PERFORMANCE RESULTS HAVE CERTAIN LIMITATIONS. UNLIKE AN ACTUAL PERFORMANCE RECORD, SIMULATED RESULTS DO NOT REPRESENT ACTUAL TRADING. ALSO, SINCE THE TRADES HAVE NOT BEEN EXECUTED, THE RESULTS MAY HAVE UNDER-OR-OVER COMPENSATED FOR THE IMPACT, IF ANY, OF CERTAIN MARKET FACTORS, SUCH AS LACK OF LIQUIDITY. SIMULATED TRADING PROGRAMS IN GENERAL ARE ALSO SUBJECT TO THE FACT THAT THEY ARE DESIGNED WITH THE BENEFIT OF HINDSIGHT. NO REPRESENTATION IS BEING MADE THAT ANY ACCOUNT WILL OR IS LIKELY TO ACHIEVE PROFIT OR LOSSES SIMILAR TO THOSE SHOWN