
Markets
Dow and S&P 500 futures are looking to continue the surge seen Wednesday, rising as much as 0.5%, though Nasdaq futures were off slightly on word of an executive order against social media companies.
Source: Seeking Alpha https://seekingalpha.com/
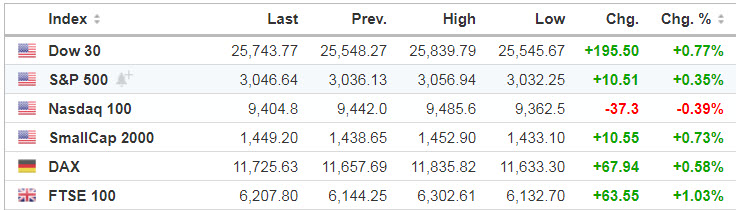
Source: https://www.investing.com/indices/indices-cfds
Economic Calendar
8:30 Durable Goods
8:30 Initial Jobless Claims
8:30 GDP Q1
8:30 Corporate profits
10:00 Pending Home Sales
10:30 EIA Natural Gas Inventory
11:00 Kansas City Fed Mfg Survey
11:00 EIA Petroleum Inventories
Source: https://www.investing.com/economic-calendar/

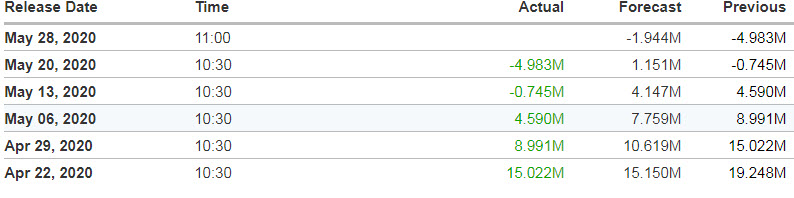
Source: https://www.investing.com/economic-calendar/eia-crude-oil-inventories-75
S&P 500 (ES)
Tuesday’s Session was Cycle Day 1 (CD1): Normal Session unfolded as price rally during GLOBEX quickly faded when RTH opened, as aggressive selling wiped-out early gains. Successful test of overnight CD1 Low (2965.50) sparked an aggressive rally which propelled price back to and exceeding overnight highs.
We identified early potential for a “Range-Runner” Day Type…Excerpt from Trading Room:
PTGDavid :(9:55:08 AM) : Range Runner
PTGDavid :(9:56:07 AM) : 80 handle reversal from prior close 2995
***New: PTG Trading Room Chat Log’s Link
…Transition from Cycle Day 1 to Cycle Day 2
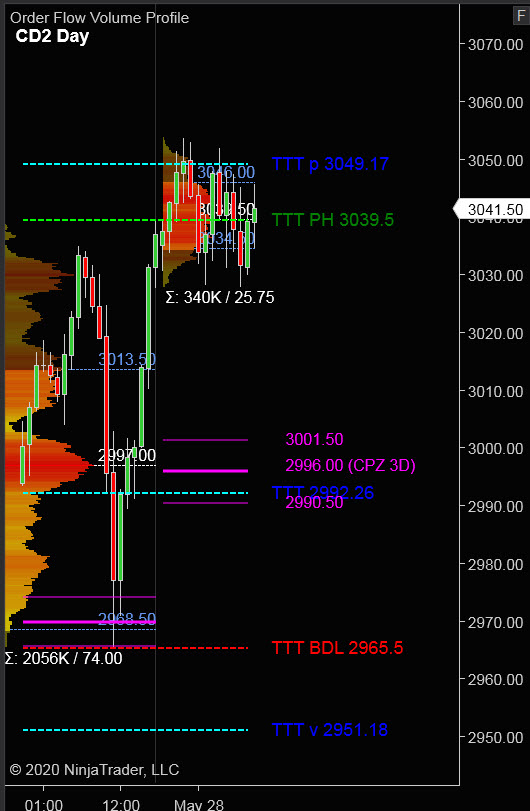
This leads us into Cycle Day 2 (CD2): Having closed near high of session we then have Two Scenarios to consider.
Bull Scenario: IF Bulls hold bid above 3040, THEN initial upside estimate targets 3050 – 3055 zone
Bear Scenario: IF Bears hold offer below 3040, THEN initial downside estimate targets 3030 – 3025 zone.
P -VA High = 3014 P – VA Low = 2969 P – POC = 2997
Range Projections and Key Levels (ES) June 2020 (M) Contract
HOD ATR Range Projection: 3070; LOD ATR Range Projection: 3012; 3 Day Central Pivot: 2996; 3 Day Cycle Target: 2992.25; 10 Day Average True Range 55.00; VIX: 28
Nasdaq 100 (NQ)
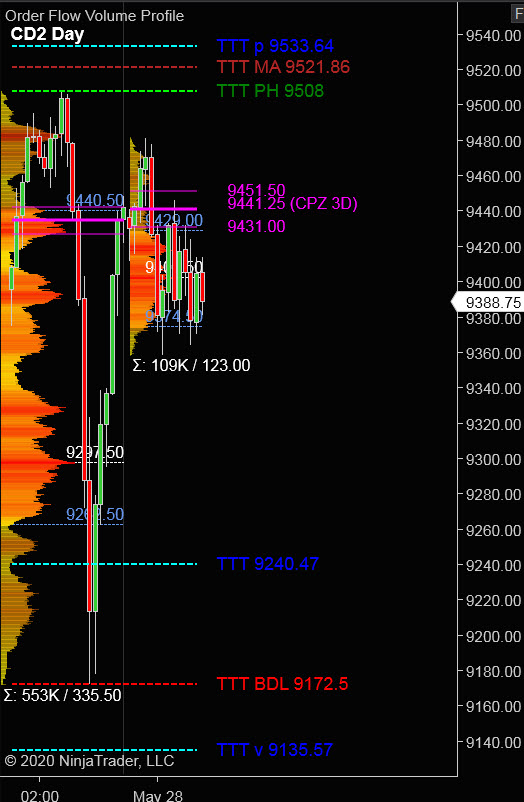
Today is Cycle Day 2 (CD2)…Today we will be anticipating more consolidation type trade action in search of the “unfounded balance”.
P – VA High = 9440 P – VA Low = 9263 P – POC = 9298
Bull Scenario: IF Bulls hold bid above 9390, THEN initial upside estimate targets 9440 – 9455 zone.
Bear Scenario: IF Bears hold offer below 9390, THEN initial downside estimate targets 9370 – 9355 zone.
Range Projections and Key Levels (NQ) June 2020 (M) Contract
HOD ATR Range Projection: 9553; LOD ATR Range Projection: 9287; 3 Day Central Pivot: 9441; 3 Day Cycle Target: 9253; 10 Day Average True Range: 208; VIX: 28
Trade Strategy: Our tactical trade strategy will simply remain unaltered…We’ll be flexible to trade both long and short side from Decision Pivot Levels. Continue to focus on Bull/Bear Stackers and Premium/Discounts. As always, remaining in alignment with dominant intra-day force increases probabilities of producing winning trades.
Stay Focused…Non-Biased…Disciplined ALWAYS USE STOPS!
Good Trading…David
“Knowing is not enough, We must APPLY. Willing is not enough, We must DO.” –Bruce Lee
*****This trade strategy report is disseminated for “education only” and should not be viewed in any way as a recommendation to buy or sell futures products.”
PAST PERFORMANCE IS NOT NECESSARILY INDICATIVE OF FUTURE RESULTS
IMPORTANT NOTICE! No representation is being made that the use of this strategy or any system or trading methodology will generate profits. Past performance is not necessarily indicative of future results. There is substantial risk of loss associated with trading securities and options on equities. Only risk capital should be used to trade. Trading securities is not suitable for everyone.
Disclaimer: Futures, Options, and Currency trading all have large potential rewards, but they also have large potential risk. You must be aware of the risks and be willing to accept them in order to invest in these markets. Don’t trade with money you can’t afford to lose.
This website is neither a solicitation nor an offer to Buy/Sell futures, options, or currencies. No representation is being made that any account will or is likely to achieve profits or losses similar to those discussed on this web site. The past performance of any trading system or methodology is not necessarily indicative of future results.
CFTC RULE 4.41 –HYPOTHETICAL OR SIMULATED PERFORMANCE RESULTS HAVE CERTAIN LIMITATIONS. UNLIKE AN ACTUAL PERFORMANCE RECORD, SIMULATED RESULTS DO NOT REPRESENT ACTUAL TRADING. ALSO, SINCE THE TRADES HAVE NOT BEEN EXECUTED, THE RESULTS MAY HAVE UNDER-OR-OVER COMPENSATED FOR THE IMPACT, IF ANY, OF CERTAIN MARKET FACTORS, SUCH AS LACK OF LIQUIDITY. SIMULATED TRADING PROGRAMS IN GENERAL ARE ALSO SUBJECT TO THE FACT THAT THEY ARE DESIGNED WITH THE BENEFIT OF HINDSIGHT. NO REPRESENTATION IS BEING MADE THAT ANY ACCOUNT WILL OR IS LIKELY TO ACHIEVE PROFIT OR LOSSES SIMILAR TO THOSE SHOWN