
Markets (Top Stories)
 Fed policymakers will conclude their May policy meeting today with an assessment on whether they’ve done enough to cool down the hottest inflation seen in 40 years. Market participants are betting that the Federal Open Market Committee isn’t finished yet in its rate-hiking moves, with an 88% probability of a 25-bps hike, according to the CME’s FedWatch Tool. That would bring the federal funds rate target range to 5.0%-5.25%, marking the first time it topped the 5% mark since the lead-up to the global financial crisis.
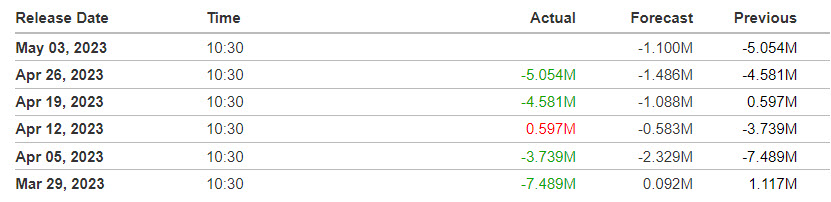
Source: Investing.com
Economic Calendar
8:15 ADP Jobs Report
9:45 PMI Composite Final
10:00 ISM Services Index
2:00 PM FOMC Announcement
2:30 PM Jerome Powell Press Conference
https://www.investing.com/economic-calendar/

10:30 EIA Petroleum Inventories
S&P 500

***Written Tuesday evening for Wednesday’s trading for contribution to MrTopStep’s “The Opening Print” publication.
Prior Session was Cycle Day 2 (CD2): Markets sold off aggressively during the AM Session as the Regional Banking Sector ETF ($KRE) plummeted more than 5%, sparking concerns of a possible contagion from the $FRC fallout. Markets stabilized during the PM Session settling near VWAP/Midpoint. Prior range was 72 handles on 1.777M contracts exchanged.
…Transition from Cycle Day 2 to Cycle Day 3
This leads us into Cycle Day 3 (CD3): Markets are below their Cycle Day 1 Low (4178.50) as historical odds favor recovery. The BIG Kahuna for today’s trade action is the FOMC and the 2:30 Presser. It’s a directional “wild-card” for today’s FED play, so strap on your seatbelts and secure your chin straps. As such, scenarios to consider for today’s trading.
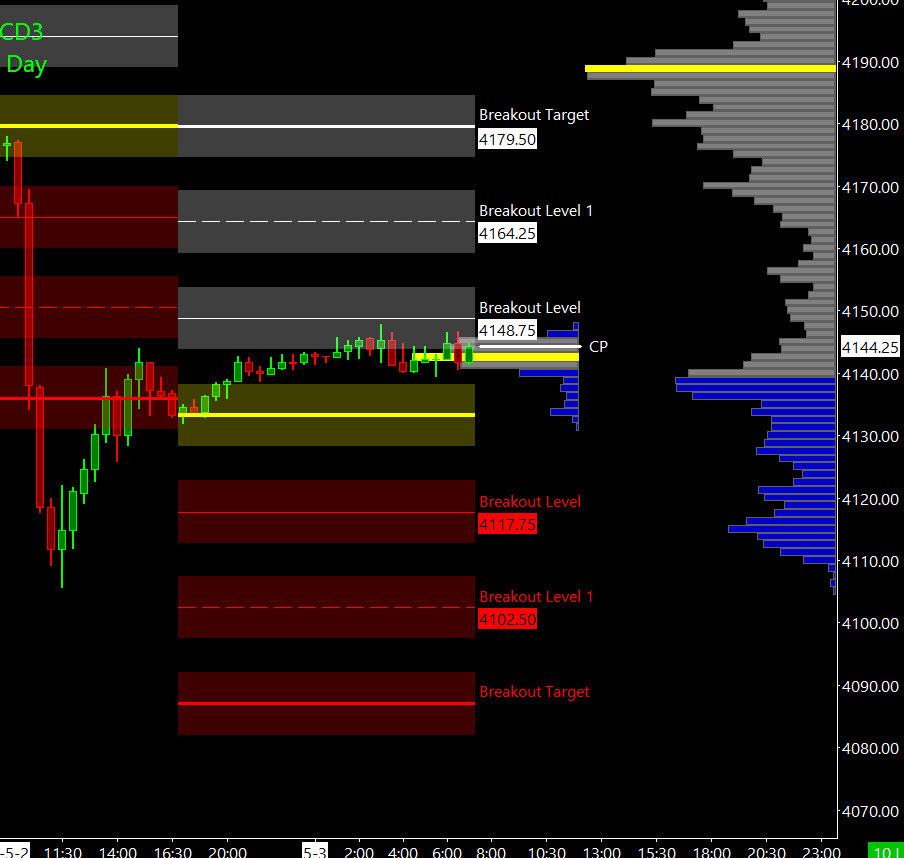
Bull Scenario: Price sustains a bid above 4135, initially targets 4165 – 4170 zone.
Bear Scenario: Price sustains an offer below 4135, initially targets 4105 – 4100 zone.
PVA High Edge = 4142 PVA Low Edge = 4113 Prior POC = 4133
*****The 3 Day Cycle has a 91% probability of fulfilling Positive Cycle Statistics covering 12 years of recorded tracking history.
For more detailed information for both bullish and bearish projected targets, please visit: PTG 3 Day Cycle and/or reference the Cycle Spreadsheet below:
Link to access full Cycle Spreadsheet > > Cycle Day 3 (CD3)
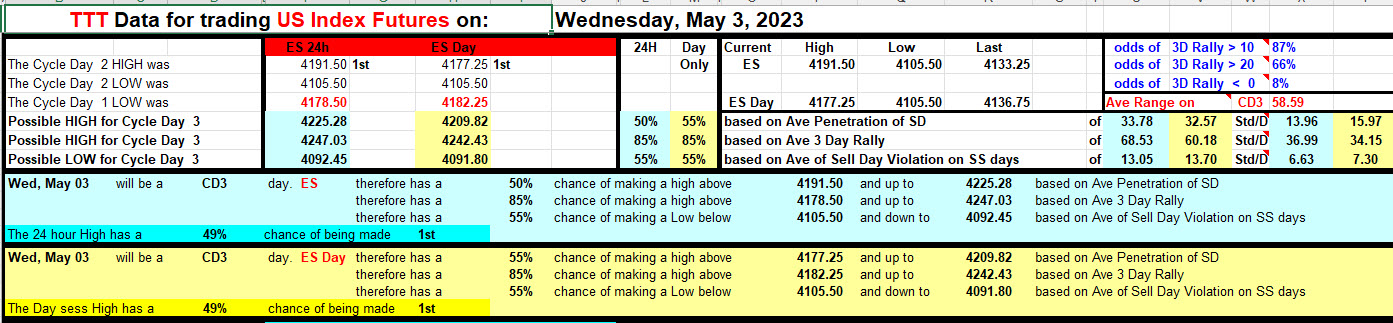
Range Projections and Key Levels (ES) June 2023 (M) Contract
HOD ATR Range Projection: 4183; LOD ATR Range Projection: 4096; 3 Day Central Pivot: 4168; 3 Day Cycle Target: 4178; 10 Day Average True Range 51; VIX: 18
Nasdaq 100 (NQ)

Prior Session was Cycle Day 2 (CD2): Markets sold off aggressively during the AM Session as the Regional Banking Sector ETF ($KRE) plummeted more than 5%, sparking concerns of a possible contagion from the $FRC fallout. Markets stabilized during the PM Session settling near VWAP/Midpoint. Prior range was 225 handles on 655k contracts exchanged.
…Transition from Cycle Day 2 to Cycle Day 3
This leads us into Cycle Day 3 (CD3): Markets are below their Cycle Day 1 Low (13258.75) as historical odds favor recovery. The BIG Kahuna for today’s trade action is the FOMC and the 2:30 Presser. It’s a directional “wild-card” for today’s FED play, so strap on your seatbelts and secure your chin straps. As such, scenarios to consider for today’s trading.
Bull Scenario: Price sustains a bid above 13160, initially targets 13260 – 13280 zone.
Bear Scenario: Price sustains an offer below 13160, initially targets 12070 – 13050 zone.
PVA High Edge = 13216 PVA Low Edge = 13119 Prior POC = 13184
Range Projections and Key Levels (NQ) June 2023 (M) Contract
HOD ATR Range Projection: 13362; LOD ATR Range Projection: 12977; 3 Day Central Pivot: 13263; 3 Day Cycle Target: 13258; 10 Day Average True Range: 206; VIX: 18

Trade Strategy: Our tactical trade strategy will simply remain unaltered…We’ll be flexible to trade both long and short side from Decision Pivot Levels. Continue to focus on Bull/Bear Stackers and Premium/Discounts. As always, remaining in alignment with dominant intra-day force increases probabilities of producing winning trades.
Stay Focused…Non-Biased…Disciplined ALWAYS USE STOPS!
Good Trading…David
“Knowing is not enough, We must APPLY. Willing is not enough, We must DO.” –Bruce Lee
*****This trade strategy report is disseminated for “education only” and should not be viewed in any way as a recommendation to buy or sell futures products.”
PAST PERFORMANCE IS NOT NECESSARILY INDICATIVE OF FUTURE RESULTS
IMPORTANT NOTICE! No representation is being made that the use of this strategy or any system or trading methodology will generate profits. Past performance is not necessarily indicative of future results. There is substantial risk of loss associated with trading securities and options on equities. Only risk capital should be used to trade. Trading securities is not suitable for everyone.
Disclaimer: Futures, Options, and Currency trading all have large potential rewards, but they also have large potential risk. You must be aware of the risks and be willing to accept them in order to invest in these markets. Don’t trade with money you can’t afford to lose.
This website is neither a solicitation nor an offer to Buy/Sell futures, options, or currencies. No representation is being made that any account will or is likely to achieve profits or losses similar to those discussed on this web site. The past performance of any trading system or methodology is not necessarily indicative of future results.
CFTC RULE 4.41 –HYPOTHETICAL OR SIMULATED PERFORMANCE RESULTS HAVE CERTAIN LIMITATIONS. UNLIKE AN ACTUAL PERFORMANCE RECORD, SIMULATED RESULTS DO NOT REPRESENT ACTUAL TRADING. ALSO, SINCE THE TRADES HAVE NOT BEEN EXECUTED, THE RESULTS MAY HAVE UNDER-OR-OVER COMPENSATED FOR THE IMPACT, IF ANY, OF CERTAIN MARKET FACTORS, SUCH AS LACK OF LIQUIDITY. SIMULATED TRADING PROGRAMS IN GENERAL ARE ALSO SUBJECT TO THE FACT THAT THEY ARE DESIGNED WITH THE BENEFIT OF HINDSIGHT. NO REPRESENTATION IS BEING MADE THAT ANY ACCOUNT WILL OR IS LIKELY TO ACHIEVE PROFIT OR LOSSES SIMILAR TO THOSE SHOWN