
Markets
The Dow Jones Industrial Average started May on the right foot, with the index climbing over 200 points yesterday as growth names took a backseat. The trend continued overnight as DJIA futures inched up, though contracts linked to the Nasdaq and S&P 500 were off by 0.3% and 0.1%, respectively.

Source: SeekingAlpha.com
Economic Calendar
8:30 Goods and Services Trade
8:55 Redbook Chain Store Sales
10:00 Factory Orders
https://www.investing.com/economic-calendar/
***New: PTG Trading Room Chat Log’s Link
S&P 500

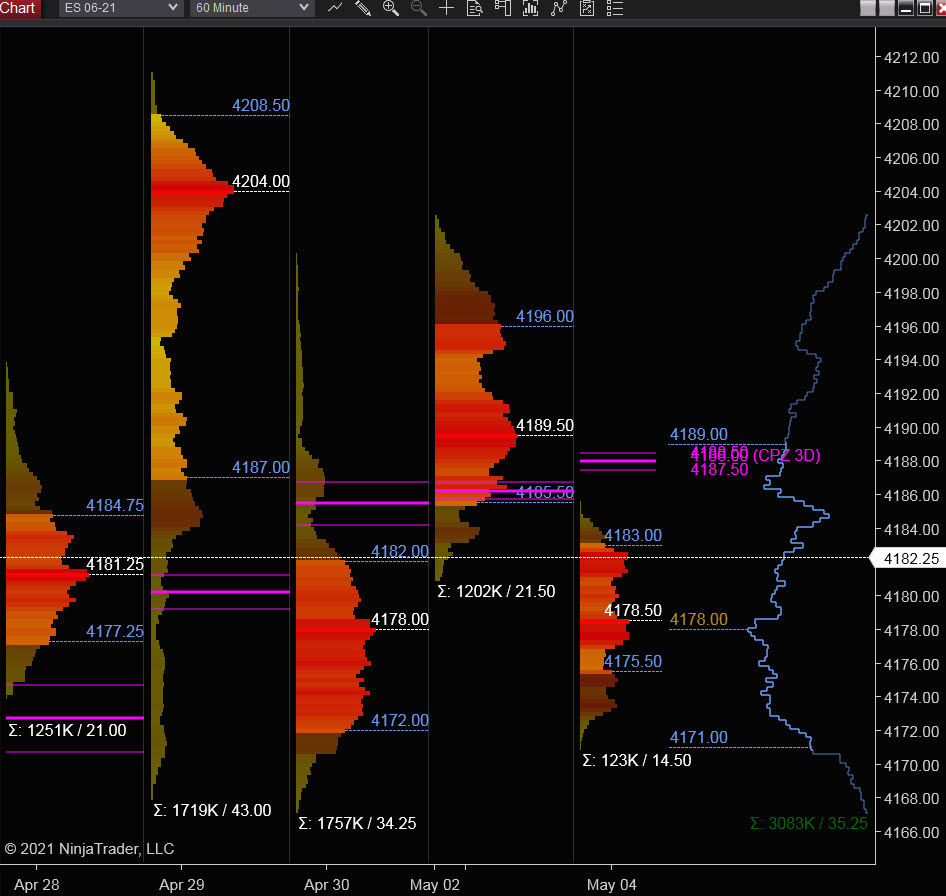
Prior Session was Cycle Day 2 (CD2): Normal CD2 session as price consolidated throughout the session with signs of weakness developing. Prior range was 21.50 handles on 1.202M contracts exchanged.
…Transition from Cycle Day 2 to Cycle Day 3
This leads us into Cycle Day 3 (CD3): Three-Day Cycle Objective (4201) has been fulfilled. We’ll mark today as “wild-card” with “Key Support” 4170 – 4167 zone. As such, there are two estimated scenarios to consider for today’s trading.
1.) Price sustains a bid above 4178, initially targets 4188 – 4190 zone.
2.) Price sustains an offer below 4178, initially targets 4170 – 4167 zone.
*****3 Day Cycle has a 91% probability of fulfilling Positive Statistic covering 12 years of recorded tracking history.
PVA High Edge = 4196 PVA Low Edge = 4186 Prior POC = 4190
Range Projections and Key Levels (ES) June 2021 (M) Contract
HOD ATR Range Projection: 4208; LOD ATR Range Projection: 4148; 3 Day Central Pivot: 4188; 3 Day Cycle Target: 4201; 10 Day Average True Range 37; VIX: 18
Nasdaq 100 (NQ)

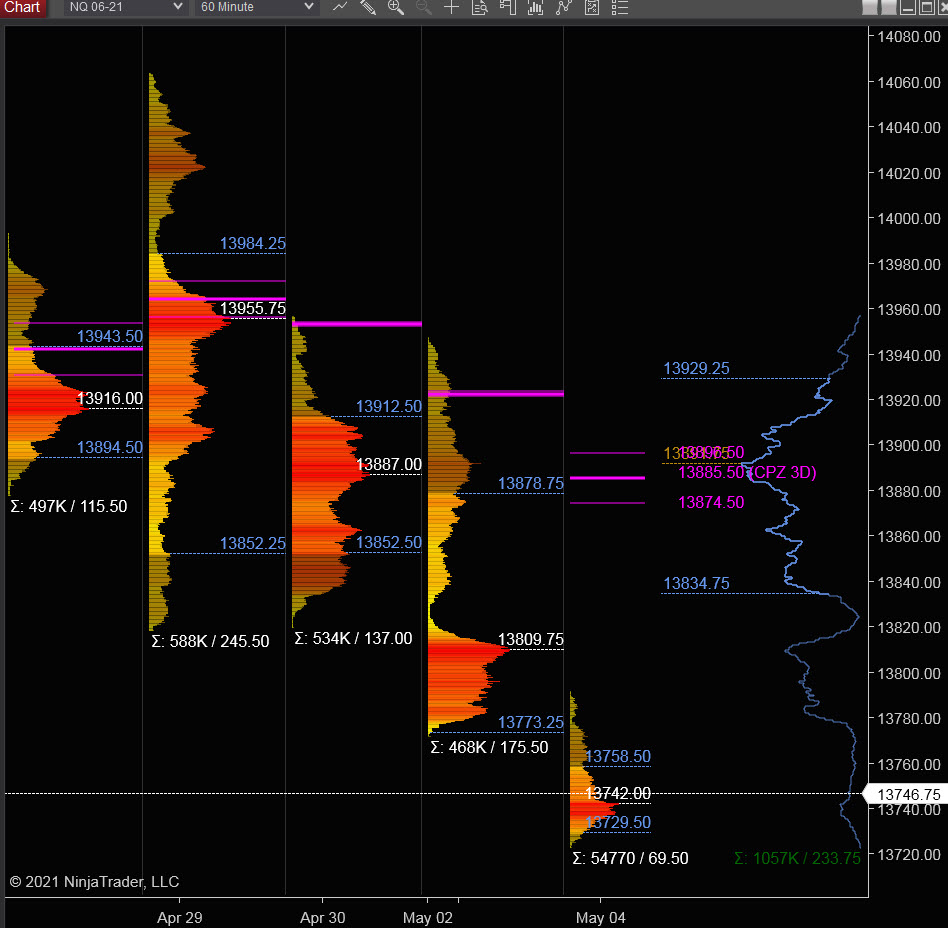
Today is Cycle Day 3 (CD3)…Price is currently trading below CD1 Low (13819.75) as considerable weakness has begun to afflict the tech sector following positive earning releases. Prior range was 175 handles on 468k contracts exchanged. As such, there are two estimated scenarios to consider for today’s trading.
PVA High Edge = 13879 PVA Low Edge = 13773 Prior POC = 13810
Bull Scenario: IF Bulls sustain a bid above 13772, THEN initial upside estimate targets 13810 – 13820 zone.
Bear Scenario: IF Bears sustain an offer below 13772, THEN initial downside estimate targets 13731 – 13711 zone.
Range Projections and Key Levels (NQ) June 2021 (M) Contract
HOD ATR Range Projection: 13904; LOD ATR Range Projection: 13611; 3 Day Central Pivot: 13885; 3 Day Cycle Target: 13918; 10 Day Average True Range: 181; VIX: 18
Trade Strategy: Our tactical trade strategy will simply remain unaltered…We’ll be flexible to trade both long and short side from Decision Pivot Levels. Continue to focus on Bull/Bear Stackers and Premium/Discounts. As always, remaining in alignment with dominant intra-day force increases probabilities of producing winning trades.
Stay Focused…Non-Biased…Disciplined ALWAYS USE STOPS!
Good Trading…David
“Knowing is not enough, We must APPLY. Willing is not enough, We must DO.” –Bruce Lee
*****This trade strategy report is disseminated for “education only” and should not be viewed in any way as a recommendation to buy or sell futures products.”
PAST PERFORMANCE IS NOT NECESSARILY INDICATIVE OF FUTURE RESULTS
IMPORTANT NOTICE! No representation is being made that the use of this strategy or any system or trading methodology will generate profits. Past performance is not necessarily indicative of future results. There is substantial risk of loss associated with trading securities and options on equities. Only risk capital should be used to trade. Trading securities is not suitable for everyone.
Disclaimer: Futures, Options, and Currency trading all have large potential rewards, but they also have large potential risk. You must be aware of the risks and be willing to accept them in order to invest in these markets. Don’t trade with money you can’t afford to lose.
This website is neither a solicitation nor an offer to Buy/Sell futures, options, or currencies. No representation is being made that any account will or is likely to achieve profits or losses similar to those discussed on this web site. The past performance of any trading system or methodology is not necessarily indicative of future results.
CFTC RULE 4.41 –HYPOTHETICAL OR SIMULATED PERFORMANCE RESULTS HAVE CERTAIN LIMITATIONS. UNLIKE AN ACTUAL PERFORMANCE RECORD, SIMULATED RESULTS DO NOT REPRESENT ACTUAL TRADING. ALSO, SINCE THE TRADES HAVE NOT BEEN EXECUTED, THE RESULTS MAY HAVE UNDER-OR-OVER COMPENSATED FOR THE IMPACT, IF ANY, OF CERTAIN MARKET FACTORS, SUCH AS LACK OF LIQUIDITY. SIMULATED TRADING PROGRAMS IN GENERAL ARE ALSO SUBJECT TO THE FACT THAT THEY ARE DESIGNED WITH THE BENEFIT OF HINDSIGHT. NO REPRESENTATION IS BEING MADE THAT ANY ACCOUNT WILL OR IS LIKELY TO ACHIEVE PROFIT OR LOSSES SIMILAR TO THOSE SHOWN