
Markets
It looks like there is another session of gains in store for Wall Street, with DJIA futures up by 120 points and the S&P 500 and Nasdaq ahead by over 0.5%.
In Asia, Japan +0.3%. Hong Kong +0.8%. China +2.6%. India +0.5%.
In Europe, at midday, London +0.5%. Paris +0.8%. Frankfurt +1.3%.
Futures at 6:20, Dow +0.5%. S&P +0.5%. Nasdaq +0.7%. Crude +0.4% to $53.49. Gold -0.2% to $1326.20. Bitcoin +2.8% to $7936.
Ten-year Treasury Yield +3 bps to 2.17%
Source: Seeking Alpha
Economic Calendar
6:00NFIB Small Business Optimism Index
8:30Producer Price Index
8:55Redbook Chain Store Sales
1:00 PMResults of $38B, 3-Year Note Auction
***PTG Trading Room Chat Log’s Link
S&P 500
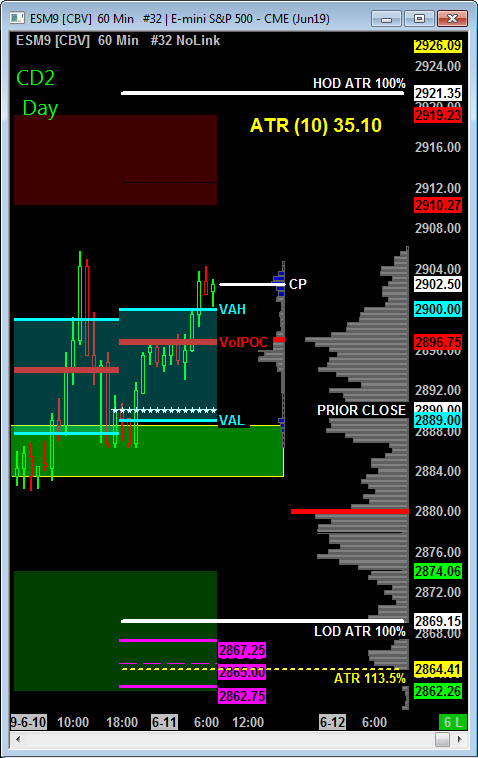
Today is Cycle Day 2 (CD2)…Having regained control Bulls continue to press price higher holding 2886 “key support”. Further expansion during this Cycle targets 2914 handle. Break below 2880 handle would jeopardize the current bullish structure.
CD2 Range High = 2910.00 CD2 Range Low = 2880.00 CD2 Range Avg = 30.00
Scenario 1: IF Bulls hold bid above 2896, THEN initial upside potential targets 2905 – 2910 zone.
Scenario 2: IF Bears hold offer below 2896, THEN initial downside objective targets 2890 – 2885 zone.
Range Projections and Key Levels (ES) June 2019 (M) Contract
HOD ATR Range Projection: 2921.50; LOD ATR Range Projection: 2869.00; 3 Day Central Pivot: 2865.00; 3 Day Cycle Target: 2908.50; 10 Day Average True Range 35.10: VIX: 15.62
Nasdaq 100 (NQ)
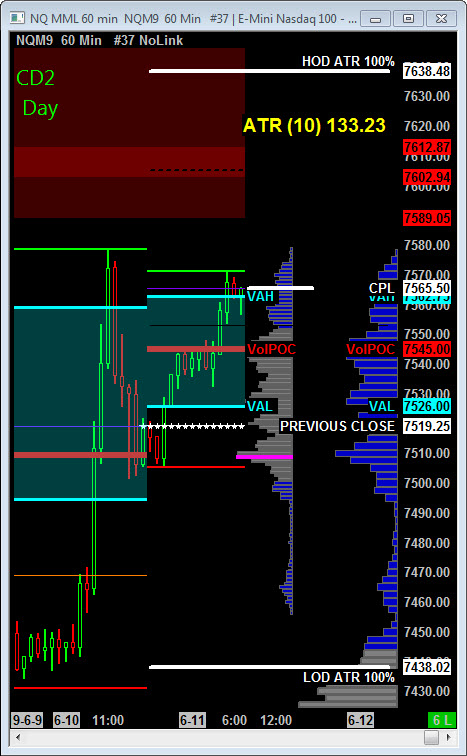
Today is Cycle Day 2 (CD2)…Price has fulfilled its 3 Day Cycle Target as bulls have firmly regained control. Further upside expansion of this rally measures 7600 – 7612 zone.
CD2 Range High = 7563.00 CD2 Range Low = 7514.00 CD2 Range Avg = 108.00
Scenario 1: IF Bulls hold bid above 7545, THEN initial upside potential targets 7563 – 7578 zone.
Scenario 2: IF Bears hold offer below 7545, THEN initial downside objective targets 7519 – 7514 zone.
Range Projections and Key Levels (NQ) June 2019 (M) Contract
HOD ATR Range Projection: 7638.50; LOD ATR Range Projection: 7438.00; 3 Day Central Pivot: 7380.00; 3 Day Cycle Target: 7555.00; 10 Day Average True Range: 133.25; VIX: 15.62
Trade Strategy: Our tactical trade strategy will simply remain unaltered…We’ll be flexible to trade both long and short side from Decision Pivot Levels. Continue to focus on Bull/Bear Stackers and Premium/Discounts. As always, remaining in alignment with dominant intra-day force increases probabilities of producing winning trades.
Stay Focused…Non-Biased…Disciplined ALWAYS USE STOPS!
Good Trading…David
“Knowing is not enough, We must APPLY. Willing is not enough, We must DO.” –Bruce Lee
*****This trade strategy report is disseminated for “education only” and should not be viewed in any way as a recommendation to buy or sell futures products.”
PAST PERFORMANCE IS NOT NECESSARILY INDICATIVE OF FUTURE RESULTS
IMPORTANT NOTICE! No representation is being made that the use of this strategy or any system or trading methodology will generate profits. Past performance is not necessarily indicative of future results. There is substantial risk of loss associated with trading securities and options on equities. Only risk capital should be used to trade. Trading securities is not suitable for everyone.
Disclaimer: Futures, Options, and Currency trading all have large potential rewards, but they also have large potential risk. You must be aware of the risks and be willing to accept them in order to invest in these markets. Don’t trade with money you can’t afford to lose.
This website is neither a solicitation nor an offer to Buy/Sell futures, options, or currencies. No representation is being made that any account will or is likely to achieve profits or losses similar to those discussed on this web site. The past performance of any trading system or methodology is not necessarily indicative of future results.
CFTC RULE 4.41 –HYPOTHETICAL OR SIMULATED PERFORMANCE RESULTS HAVE CERTAIN LIMITATIONS. UNLIKE AN ACTUAL PERFORMANCE RECORD, SIMULATED RESULTS DO NOT REPRESENT ACTUAL TRADING. ALSO, SINCE THE TRADES HAVE NOT BEEN EXECUTED, THE RESULTS MAY HAVE UNDER-OR-OVER COMPENSATED FOR THE IMPACT, IF ANY, OF CERTAIN MARKET FACTORS, SUCH AS LACK OF LIQUIDITY. SIMULATED TRADING PROGRAMS IN GENERAL ARE ALSO SUBJECT TO THE FACT THAT THEY ARE DESIGNED WITH THE BENEFIT OF HINDSIGHT. NO REPRESENTATION IS BEING MADE THAT ANY ACCOUNT WILL OR IS LIKELY TO ACHIEVE PROFIT OR LOSSES SIMILAR TO THOSE SHOWN