
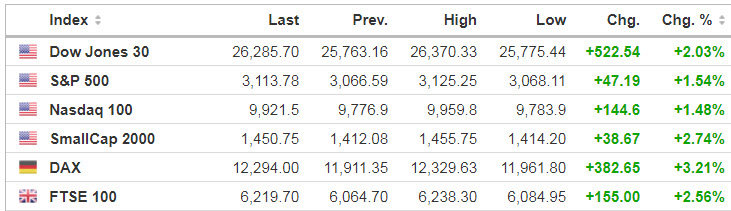
Markets
A big turnaround on Wall Street was seen Monday as the S&P 500 erased a 2.5% drop on word that the Fed would begin buying individual corporate bonds, on top of the ETFs it’s already snapping up (see more below). Futures are adding to the gains this morning
Source: SeekingAlpha.com
Economic Calendar
8:30 Retail Sales
8:55 Redbook Chain Store Sales
9:15 Industrial Production
10:00 NAHB Housing Market Index
10:00 Business Inventories
10:00 Powell Testifies on Semi-Annual Monetary Policy
https://www.investing.com/economic-calendar/
***New: PTG Trading Room Chat Log’s Link
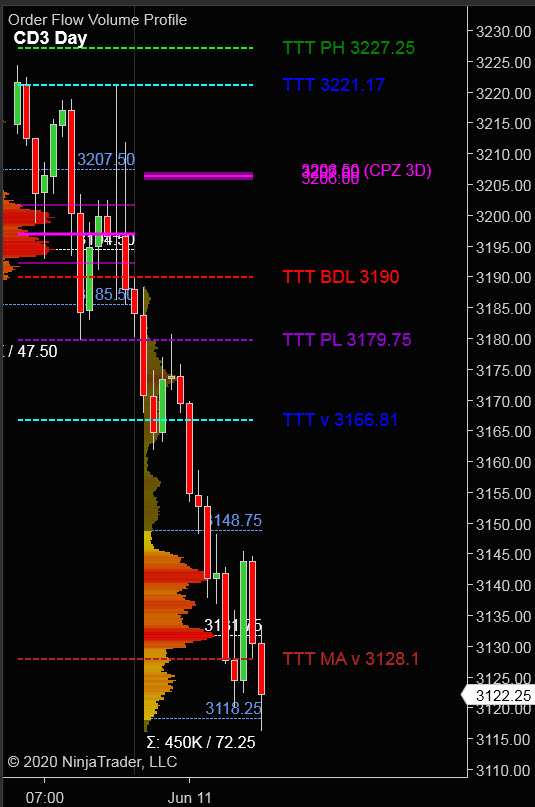
S&P 500
Prior Session was Cycle Day 2 (CD2): Globex Session opened below CD1 Low (2971) fulfilling CD2 Lower Violation Levels at which time this cycle’s rally began. Rally continued throughout the US-RTH Session closing on high of day (3068.25).
…Transition from Cycle Day 2 to Cycle Day 3
This leads us into Cycle Day 3 (CD3): Having closed on high of day, we then have two scenarios to consider:
1.) Price continues rally above PH (3068.25) initially targeting 3104 – 3105 3 Day Cycle Rally Objective.
2.) Price is rejected at PH (3068.25) initially targeting 3058 – 3052 zone.
*****3 Day Cycle has a 91% probability of fulfilling Positive Statistic covering 12 years of recorded tracking history.
PVA High Edge = 3067.75 PVA Low Edge = 2982.75 Prior POC = 3057.25
Range Projections and Key Levels (ES) September 2020 (U) Contract
HOD ATR Range Projection: 3136; LOD ATR Range Projection: 3038; 3 Day Central Pivot: 3033; 3 Day Cycle Target: 3105; 10 Day Average True Range 75.50; VIX: 34.00
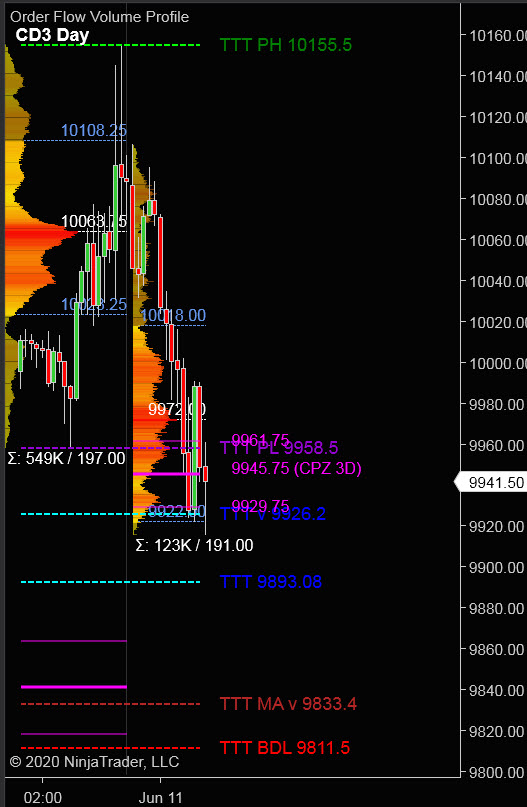
Nasdaq 100 (NQ)
Today is Cycle Day 3 (CD3)…Price has fulfilled Positive 3 Day Cycle Statistic target zone between 9875 – 9912.
PVA High Edge = 9688 PVA Low Edge = 9458 Prior POC = 9600
Bull Scenario: IF Bulls hold bid above 9803, THEN initial upside estimate targets 9875 – 9912 3 Day Cycle Target Zone.
Bear Scenario: IF Bears hold offer below 9803, THEN initial downside estimate targets 9755 – 9740 zone.
Range Projections and Key Levels (NQ) September 2020 (U) Contract
HOD ATR Range Projection: 10017; LOD ATR Range Projection: 9719; 3 Day Central Pivot: 9690; 3 Day Cycle Target: 9875; 10 Day Average True Range: 229; VIX: 34.00
Trade Strategy: Our tactical trade strategy will simply remain unaltered…We’ll be flexible to trade both long and short side from Decision Pivot Levels. Continue to focus on Bull/Bear Stackers and Premium/Discounts. As always, remaining in alignment with dominant intra-day force increases probabilities of producing winning trades.
Stay Focused…Non-Biased…Disciplined ALWAYS USE STOPS!
Good Trading…David
“Knowing is not enough, We must APPLY. Willing is not enough, We must DO.” –Bruce Lee
*****This trade strategy report is disseminated for “education only” and should not be viewed in any way as a recommendation to buy or sell futures products.”
PAST PERFORMANCE IS NOT NECESSARILY INDICATIVE OF FUTURE RESULTS
IMPORTANT NOTICE! No representation is being made that the use of this strategy or any system or trading methodology will generate profits. Past performance is not necessarily indicative of future results. There is substantial risk of loss associated with trading securities and options on equities. Only risk capital should be used to trade. Trading securities is not suitable for everyone.
Disclaimer: Futures, Options, and Currency trading all have large potential rewards, but they also have large potential risk. You must be aware of the risks and be willing to accept them in order to invest in these markets. Don’t trade with money you can’t afford to lose.
This website is neither a solicitation nor an offer to Buy/Sell futures, options, or currencies. No representation is being made that any account will or is likely to achieve profits or losses similar to those discussed on this web site. The past performance of any trading system or methodology is not necessarily indicative of future results.
CFTC RULE 4.41 –HYPOTHETICAL OR SIMULATED PERFORMANCE RESULTS HAVE CERTAIN LIMITATIONS. UNLIKE AN ACTUAL PERFORMANCE RECORD, SIMULATED RESULTS DO NOT REPRESENT ACTUAL TRADING. ALSO, SINCE THE TRADES HAVE NOT BEEN EXECUTED, THE RESULTS MAY HAVE UNDER-OR-OVER COMPENSATED FOR THE IMPACT, IF ANY, OF CERTAIN MARKET FACTORS, SUCH AS LACK OF LIQUIDITY. SIMULATED TRADING PROGRAMS IN GENERAL ARE ALSO SUBJECT TO THE FACT THAT THEY ARE DESIGNED WITH THE BENEFIT OF HINDSIGHT. NO REPRESENTATION IS BEING MADE THAT ANY ACCOUNT WILL OR IS LIKELY TO ACHIEVE PROFIT OR LOSSES SIMILAR TO THOSE SHOWN