
Markets
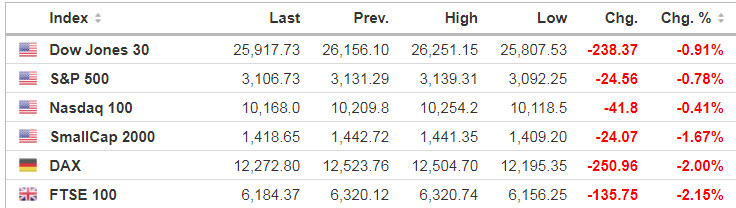
Futures were already dipping into the red after the Nasdaq Composite notched a fresh record high, though contracts tied to the S&P 500 are now pointing to a 1% decline on worries about a wider transatlantic trade fight.
Source: SeekingAlpha.com
Economic Calendar
9:00 FHFA House Price Index
10:00 State Street Investor Confidence Index
10:30 EIA Petroleum Inventories
11:00 Survey of Business Uncertainty
11:30 Results of $20B, 2-Year FRN Auction
12:30 PM Fed’s Evans: U.S. Monetary Policy
1:00 PM Results of $47B, 5-Year Note Auction
2:00 PM Fed’s Bullard: “COVID-19 and the Economy”
https://www.investing.com/economic-calendar/

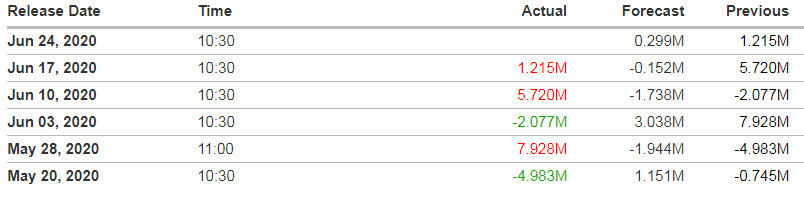
Source: https://www.investing.com/economic-calendar/eia-crude-oil-inventories-75
***New: PTG Trading Room Chat Log’s Link
S&P 500
***Written 7 pm Tuesday evening for Wednesday’s trading with contribution to Mr. TopStep’s Opening Print Newsletter
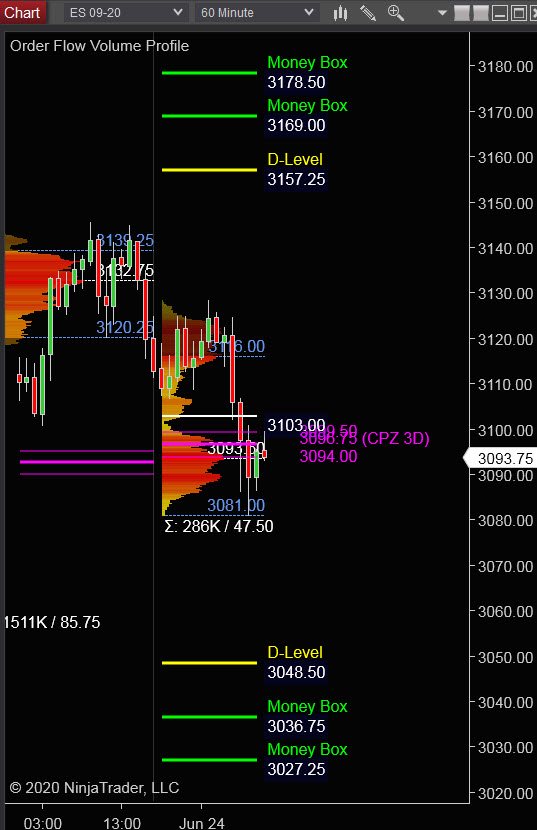
Tuesday’s Session was Cycle Day 2 (CD2): Price fulfilled upside Cycle Targets (3115) early GLOBEX and continued to rally during RTH fulfilling 3138 Money Box Level.
…Transition from Cycle Day 2 to Cycle Day 3
This leads us into Cycle Day 3 (CD3): Having fulfilled Positive 3 Day Cycle Statistic Objectives, we then have Two Scenarios to consider.
1.) Price sustains a bid above 3112, targeting 3125 – 3135 zone.
2.) Price sustains an offer below 3112 targeting 3095 – 3090 zone.
*****3 Day Cycle has a 91% probability of fulfilling Positive Statistic covering 12 years of recorded tracking history.
PVA High Edge = 3140 PVA Low Edge = 3120 Prior POC = 3133
Range Projections and Key Levels (ES) September 2020 (U) Contract
HOD ATR Range Projection: 3136; LOD ATR Range Projection: 3070; 3 Day Central Pivot: 3097; 3 Day Cycle Target: 3113; 10 Day Average True Range 76; VIX: 33
Nasdaq 100 (NQ)
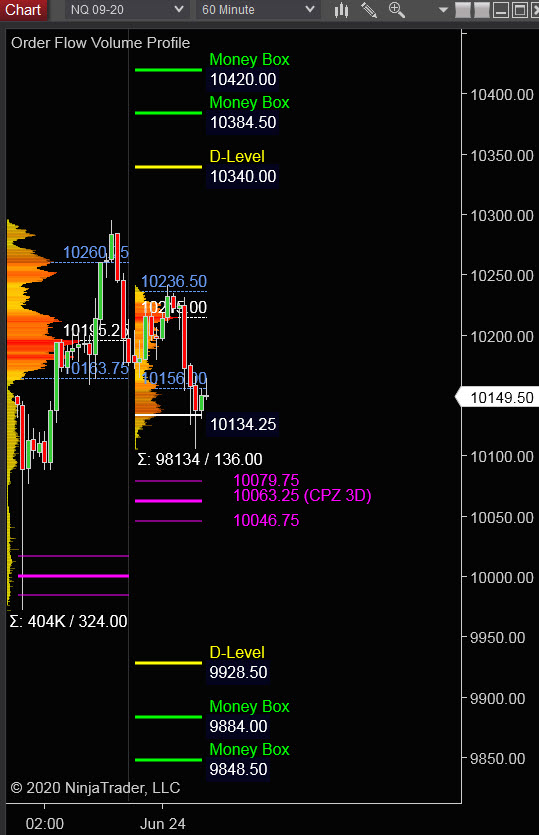
Today is Cycle Day 3 (CD3)…Price has fulfilled Positive 3 Day Rally Statistic ans as such today is marked as a “wild-card” day, meaning directionally both sides could be “in-play”.
PVA High Edge = 10260 PVA Low Edge = 10165 Prior POC = 10195
Bull Scenario: IF Bulls hold bid above 10155, THEN initial upside estimate targets 10215 – 10235 zone.
Bear Scenario: IF Bears hold offer below 10155, THEN initial downside estimate targets 10080 – 10047 zone.
Range Projections and Key Levels (NQ) September 2020 (U) Contract
HOD ATR Range Projection: 10201; LOD ATR Range Projection: 10067; 3 Day Central Pivot: 10063; 3 Day Cycle Target: 10205; 10 Day Average True Range: 229; VIX: 33
Trade Strategy: Our tactical trade strategy will simply remain unaltered…We’ll be flexible to trade both long and short side from Decision Pivot Levels. Continue to focus on Bull/Bear Stackers and Premium/Discounts. As always, remaining in alignment with dominant intra-day force increases probabilities of producing winning trades.
Stay Focused…Non-Biased…Disciplined ALWAYS USE STOPS!
Good Trading…David
“Knowing is not enough, We must APPLY. Willing is not enough, We must DO.” –Bruce Lee
*****This trade strategy report is disseminated for “education only” and should not be viewed in any way as a recommendation to buy or sell futures products.”
PAST PERFORMANCE IS NOT NECESSARILY INDICATIVE OF FUTURE RESULTS
IMPORTANT NOTICE! No representation is being made that the use of this strategy or any system or trading methodology will generate profits. Past performance is not necessarily indicative of future results. There is substantial risk of loss associated with trading securities and options on equities. Only risk capital should be used to trade. Trading securities is not suitable for everyone.
Disclaimer: Futures, Options, and Currency trading all have large potential rewards, but they also have large potential risk. You must be aware of the risks and be willing to accept them in order to invest in these markets. Don’t trade with money you can’t afford to lose.
This website is neither a solicitation nor an offer to Buy/Sell futures, options, or currencies. No representation is being made that any account will or is likely to achieve profits or losses similar to those discussed on this web site. The past performance of any trading system or methodology is not necessarily indicative of future results.
CFTC RULE 4.41 –HYPOTHETICAL OR SIMULATED PERFORMANCE RESULTS HAVE CERTAIN LIMITATIONS. UNLIKE AN ACTUAL PERFORMANCE RECORD, SIMULATED RESULTS DO NOT REPRESENT ACTUAL TRADING. ALSO, SINCE THE TRADES HAVE NOT BEEN EXECUTED, THE RESULTS MAY HAVE UNDER-OR-OVER COMPENSATED FOR THE IMPACT, IF ANY, OF CERTAIN MARKET FACTORS, SUCH AS LACK OF LIQUIDITY. SIMULATED TRADING PROGRAMS IN GENERAL ARE ALSO SUBJECT TO THE FACT THAT THEY ARE DESIGNED WITH THE BENEFIT OF HINDSIGHT. NO REPRESENTATION IS BEING MADE THAT ANY ACCOUNT WILL OR IS LIKELY TO ACHIEVE PROFIT OR LOSSES SIMILAR TO THOSE SHOWN