
Markets
In Asia, Japan +1.2%. Hong Kong +1.4%. China +0.7%. India -0.1%.
In Europe, at midday, London +0.1%. Paris flat. Frankfurt +0.5%.
Futures at 6:20, Dow -0.3%. S&P +0.2%. Nasdaq +0.2%. Crude -1.1% to $58.85. Gold -0.7% to $1405.90. Bitcoin -7.7% to $11619.
Ten-year Treasury Yield flat at 2.05%
Source: Seeking Alpha https://seekingalpha.com
Economic Calendar
8:30Initial Jobless Claims
8:30GDP Q1
8:30Corporate profits
10:00Pending Home Sales
10:30EIA Natural Gas Inventory
11:00Kansas City Fed Mfg Survey
1:00 PMResults of $32B, 7-Year Note Auction
4:30 PMMoney Supply
4:30 PMFed Balance Sheet
***PTG Trading Room Chat Log’s Link
S&P 500
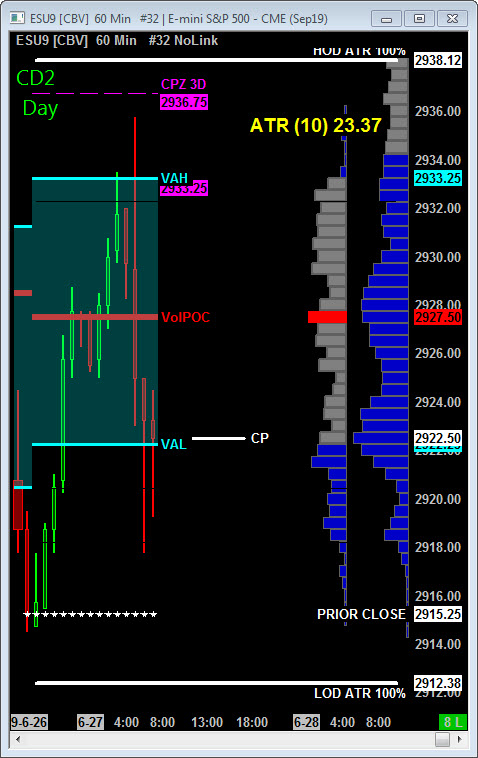
Today is Cycle Day 2 (CD2)…Price struggled to find a consistent bid throughout prior session, ultimately closing near session lows. Overnight trade attempted a rally back to prior resistance and again has retreated back toward session lows. Expectation is for continued “see-sawing” back n forth as market seeks to find price stability and balance.
CD2 Range High = 2943.00 CD2 Range Low = 2912.00 CD2 Range Avg = 29.00
Scenario 1: IF Bulls hold bid above 2926, THEN initial upside potential targets 2934 – 2936 zone.
Scenario 2: IF Bears hold offer below 2926, THEN initial downside objective targets 2916 – 2914 zone.
Range Projections and Key Levels (ES) September 2019 (U) Contract
HOD ATR Range Projection: 2938.00; LOD ATR Range Projection: 2912.00; 3 Day Central Pivot: 2936.00; 3 Day Cycle Target: 2943.00; 10 Day Average True Range 23.37: VIX: 16.25
Nasdaq 100 (NQ)
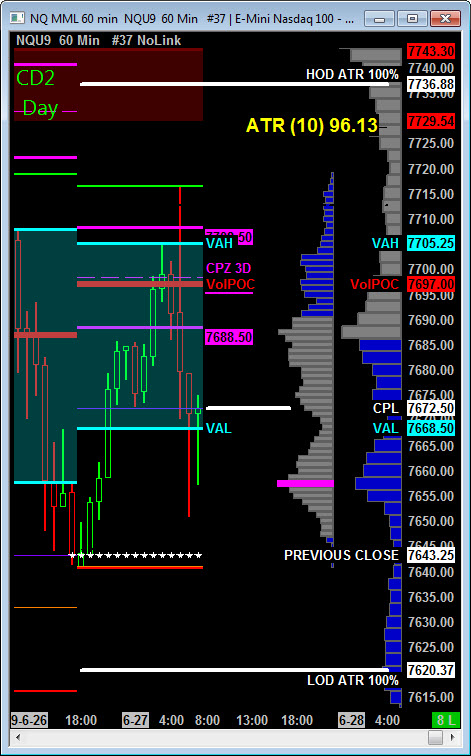
Today is Cycle Day 2 (CD2)…Price struggled to find a consistent bid throughout prior session, ultimately closing near session lows. Overnight trade attempted a rally back to prior resistance and again has retreated back toward session lows. Expectation is for continued “see-sawing” back n forth as market seeks to find price stability and balance.
CD2 Range High = 7698.00 CD2 Range Low = 7658.00 CD2 Range Avg = 104.00
Scenario 1: IF Bulls hold bid above 7670, THEN initial upside potential targets 7710 – 7725 zone.
Scenario 2: IF Bears hold offer below 7670, THEN initial downside objective targets 7658 – 7643 zone.
Range Projections and Key Levels (NQ) September 2019 (U) Contract
HOD ATR Range Projection: 7737.00; LOD ATR Range Projection: 7620.00; 3 Day Central Pivot: 7698.00; 3 Day Cycle Target: 7736.00; 10 Day Average True Range: 96.13; VIX: 16.25
Trade Strategy: Our tactical trade strategy will simply remain unaltered…We’ll be flexible to trade both long and short side from Decision Pivot Levels. Continue to focus on Bull/Bear Stackers and Premium/Discounts. As always, remaining in alignment with dominant intra-day force increases probabilities of producing winning trades.
Stay Focused…Non-Biased…Disciplined ALWAYS USE STOPS!
Good Trading…David
“Knowing is not enough, We must APPLY. Willing is not enough, We must DO.” –Bruce Lee
*****This trade strategy report is disseminated for “education only” and should not be viewed in any way as a recommendation to buy or sell futures products.”
PAST PERFORMANCE IS NOT NECESSARILY INDICATIVE OF FUTURE RESULTS
IMPORTANT NOTICE! No representation is being made that the use of this strategy or any system or trading methodology will generate profits. Past performance is not necessarily indicative of future results. There is substantial risk of loss associated with trading securities and options on equities. Only risk capital should be used to trade. Trading securities is not suitable for everyone.
Disclaimer: Futures, Options, and Currency trading all have large potential rewards, but they also have large potential risk. You must be aware of the risks and be willing to accept them in order to invest in these markets. Don’t trade with money you can’t afford to lose.
This website is neither a solicitation nor an offer to Buy/Sell futures, options, or currencies. No representation is being made that any account will or is likely to achieve profits or losses similar to those discussed on this web site. The past performance of any trading system or methodology is not necessarily indicative of future results.
CFTC RULE 4.41 –HYPOTHETICAL OR SIMULATED PERFORMANCE RESULTS HAVE CERTAIN LIMITATIONS. UNLIKE AN ACTUAL PERFORMANCE RECORD, SIMULATED RESULTS DO NOT REPRESENT ACTUAL TRADING. ALSO, SINCE THE TRADES HAVE NOT BEEN EXECUTED, THE RESULTS MAY HAVE UNDER-OR-OVER COMPENSATED FOR THE IMPACT, IF ANY, OF CERTAIN MARKET FACTORS, SUCH AS LACK OF LIQUIDITY. SIMULATED TRADING PROGRAMS IN GENERAL ARE ALSO SUBJECT TO THE FACT THAT THEY ARE DESIGNED WITH THE BENEFIT OF HINDSIGHT. NO REPRESENTATION IS BEING MADE THAT ANY ACCOUNT WILL OR IS LIKELY TO ACHIEVE PROFIT OR LOSSES SIMILAR TO THOSE SHOWN