
Markets
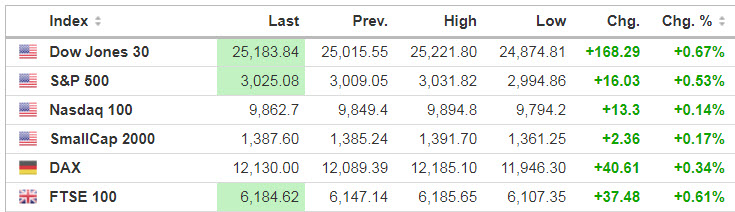
Following a brutal selloff on Friday, U.S. stock index futures seesawed overnight as investors digested the latest coronavirus infection rates and what it will mean for the economy. At the time of writing, Dow futures are up 168 points, the S&P 500 is ahead by 0.67%, while contracts tied to the Nasdaq are dipping into the red due to troubles at Facebook (FB).
Source: SeekingAlpha.com
Economic Calendar
10:00 Pending Home Sales
10:30 Dallas Fed Manufacturing Survey
3:00 PM Fed’s Williams Speech
https://www.investing.com/economic-calendar/
***New: PTG Trading Room Chat Log’s Link
S&P 500
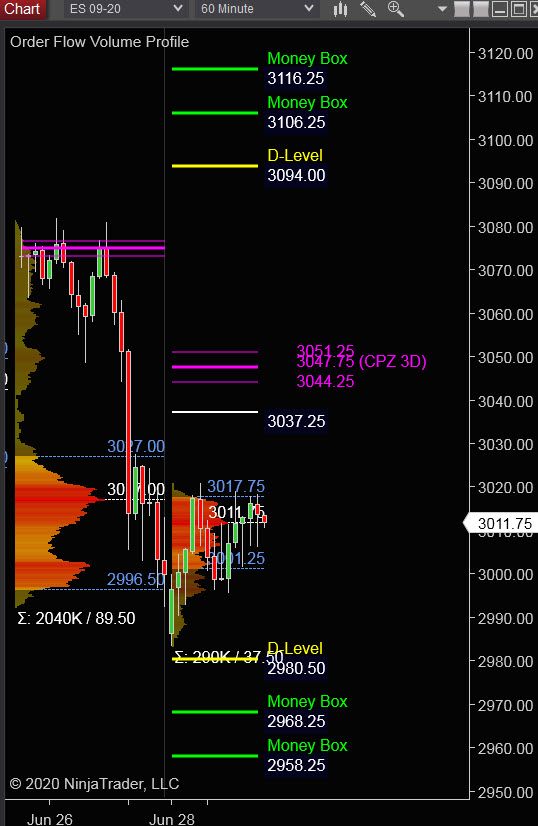
Friday’s Session was Cycle Day 2 (CD2): “Risk-Off” was the theme in prior session as price declined across the board testing CD1 Low (3005), closing slightly below.
…Transition from Cycle Day 2 to Cycle Day 3
This leads us into Cycle Day 3 (CD3): Price has fulfilled Positive 3 Day Cycle Statistic Objectives trading above CD1 low (3005) during GLOBEX and as such, we then have Two Scenarios to consider.
1.) Price sustains a bid above 3005, targeting 3015 – 3030 zone.
2.) Price sustains an offer below 3005 targeting 2995 – 2980 zone.
*****3 Day Cycle has a 91% probability of fulfilling Positive Statistic covering 12 years of recorded tracking history.
PVA High Edge = 3028 PVA Low Edge = 2997 Prior POC = 3017
Range Projections and Key Levels (ES) September 2020 (U) Contract
HOD ATR Range Projection: 3050; LOD ATR Range Projection: 2954; 3 Day Central Pivot: 3048; 3 Day Cycle Target: 3123; 10 Day Average True Range 66; VIX: 35
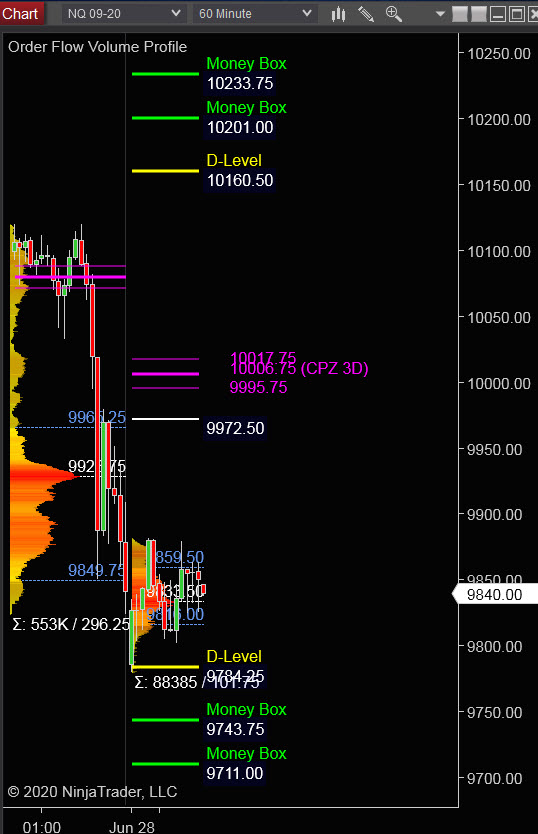
Nasdaq 100 (NQ)
Today is Cycle Day 3 (CD3)…Price has yet to fulfill Positive 3 Day Rally Statistic as price remains below CD1 Low (9885.50). Odds are favorable for recovering back above during today’s session.
PVA High Edge = 9965 PVA Low Edge = 9850 Prior POC = 9928
Bull Scenario: IF Bulls hold bid above 9885, THEN initial upside estimate targets 9930 – 9965 zone.
Bear Scenario: IF Bears hold offer below 9885, THEN initial downside estimate targets 9783 – 9743 zone.
Range Projections and Key Levels (NQ) September 2020 (U) Contract
HOD ATR Range Projection: 9985; LOD ATR Range Projection: 9678; 3 Day Central Pivot: 10007; 3 Day Cycle Target: 10246; 10 Day Average True Range: 204; VIX: 35
Trade Strategy: Our tactical trade strategy will simply remain unaltered…We’ll be flexible to trade both long and short side from Decision Pivot Levels. Continue to focus on Bull/Bear Stackers and Premium/Discounts. As always, remaining in alignment with dominant intra-day force increases probabilities of producing winning trades.
Stay Focused…Non-Biased…Disciplined ALWAYS USE STOPS!
Good Trading…David
“Knowing is not enough, We must APPLY. Willing is not enough, We must DO.” –Bruce Lee
*****This trade strategy report is disseminated for “education only” and should not be viewed in any way as a recommendation to buy or sell futures products.”
PAST PERFORMANCE IS NOT NECESSARILY INDICATIVE OF FUTURE RESULTS
IMPORTANT NOTICE! No representation is being made that the use of this strategy or any system or trading methodology will generate profits. Past performance is not necessarily indicative of future results. There is substantial risk of loss associated with trading securities and options on equities. Only risk capital should be used to trade. Trading securities is not suitable for everyone.
Disclaimer: Futures, Options, and Currency trading all have large potential rewards, but they also have large potential risk. You must be aware of the risks and be willing to accept them in order to invest in these markets. Don’t trade with money you can’t afford to lose.
This website is neither a solicitation nor an offer to Buy/Sell futures, options, or currencies. No representation is being made that any account will or is likely to achieve profits or losses similar to those discussed on this web site. The past performance of any trading system or methodology is not necessarily indicative of future results.
CFTC RULE 4.41 –HYPOTHETICAL OR SIMULATED PERFORMANCE RESULTS HAVE CERTAIN LIMITATIONS. UNLIKE AN ACTUAL PERFORMANCE RECORD, SIMULATED RESULTS DO NOT REPRESENT ACTUAL TRADING. ALSO, SINCE THE TRADES HAVE NOT BEEN EXECUTED, THE RESULTS MAY HAVE UNDER-OR-OVER COMPENSATED FOR THE IMPACT, IF ANY, OF CERTAIN MARKET FACTORS, SUCH AS LACK OF LIQUIDITY. SIMULATED TRADING PROGRAMS IN GENERAL ARE ALSO SUBJECT TO THE FACT THAT THEY ARE DESIGNED WITH THE BENEFIT OF HINDSIGHT. NO REPRESENTATION IS BEING MADE THAT ANY ACCOUNT WILL OR IS LIKELY TO ACHIEVE PROFIT OR LOSSES SIMILAR TO THOSE SHOWN