
Markets
The sentiment led S&P 500 futures to tack on another 0.6% gain overnight
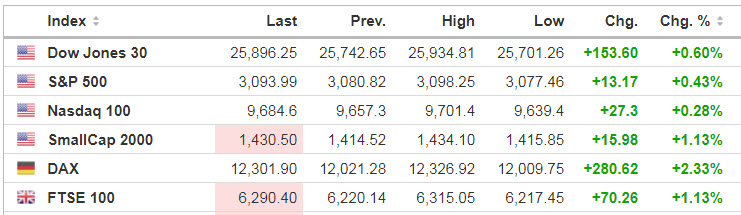
Source: https://www.investing.com/indices/indices-cfds
Source: SeekingAlpha.com
Economic Calendar
8:15 ADP Jobs Report
9:45 PMI Services Index
10:00 ISM Non-Manufacturing Index
10:00 Factory Orders
10:30 EIA Petroleum Inventories
https://www.investing.com/economic-calendar/
***New: PTG Trading Room Chat Log’s Link
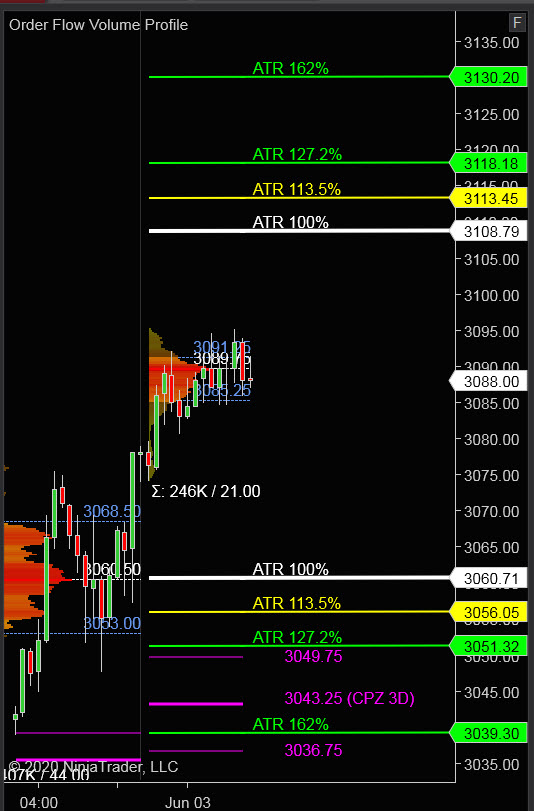
S&P 500
***Written 8 pm Tuesday evening for Wednesday’s trading and contribution to Mr Top Step’s Opening Print https://mrtopstep.com/the-opening-print/
Tuesday’s Session was Cycle Day 2 (CD2): Session unfolded as a “normal” CD2 with price testing key support and resistance zones early in the day, establishing a balanced range zone albeit with higher developing Value Zone. Market on Close Buy Imbalance to the tune of $3.5 Billion surprised most traders driving price higher into settlement.
…Transition from Cycle Day 2 to Cycle Day 3
This leads us into Cycle Day 3 (CD3): Having closed at session highs and having fulfilled 3 Day Cycle Objectives, we then have Two Scenarios to consider.
- Price continues higher targeting 3089 – 3095 CD3 Upper Penetration Range Zone with 3100 – 3105 upper ATR (3) Zone.
- Price fails to sustain bid above CD2 High (3079) converting and reverting back into prior range targeting 3071 – 3064 Central Pivot Zone.
*****3 Day Cycle has a 91% probability of fulfilling Positive Statistic covering 12 years of recorded tracking history.
PVA High Edge = 3068 PVA Low Edge = 3053 Prior POC = 3060
Range Projections and Key Levels (ES) June 2020 (M) Contract
HOD ATR Range Projection: 3109; LOD ATR Range Projection: 3060; 3 Day Central Pivot: 3043; 3 Day Cycle Target: 3059; 10 Day Average True Range 49; VIX: 27.00
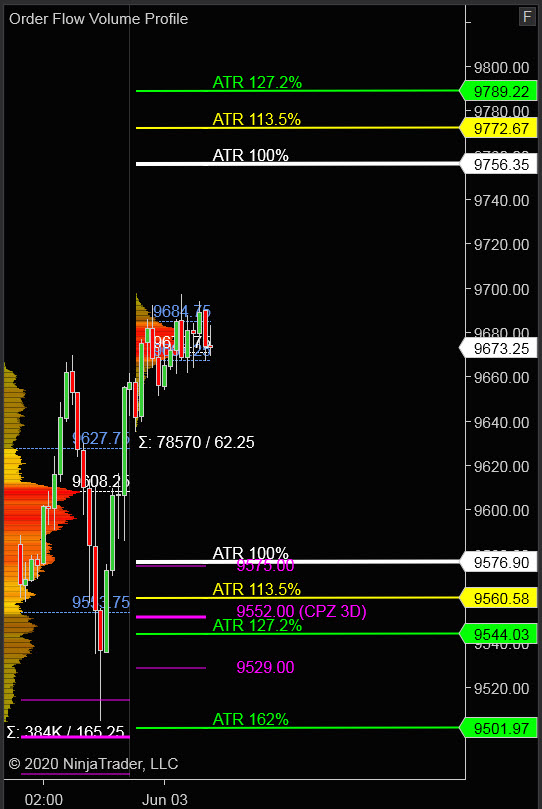
Nasdaq 100 (NQ)
Today is Cycle Day 3 (CD3)…Price has fulfilled Positive 3 Day Cycle Statistic and is currently trading above prior high (9670). Bulls will need to sustain bid above this level for continuation higher. Upside CD3 Penetration Level (9696) has been fulfilled.
PVA High Edge = 9628 PVA Low Edge = 9554 Prior POC = 9608
Bull Scenario: IF Bulls hold bid above 9670, THEN initial upside estimate targets 9690 – 9700 zone.
Bear Scenario: IF Bears hold offer below 9670, THEN initial downside estimate targets 9628 – 9608 zone.
Range Projections and Key Levels (NQ) June 2020 (M) Contract
HOD ATR Range Projection: 9757; LOD ATR Range Projection: 9576; 3 Day Central Pivot: 9559; 3 Day Cycle Target: 9531; 10 Day Average True Range: 180; VIX: 27.00
Trade Strategy: Our tactical trade strategy will simply remain unaltered…We’ll be flexible to trade both long and short side from Decision Pivot Levels. Continue to focus on Bull/Bear Stackers and Premium/Discounts. As always, remaining in alignment with dominant intra-day force increases probabilities of producing winning trades.
Stay Focused…Non-Biased…Disciplined ALWAYS USE STOPS!
Good Trading…David
“Knowing is not enough, We must APPLY. Willing is not enough, We must DO.” –Bruce Lee
*****This trade strategy report is disseminated for “education only” and should not be viewed in any way as a recommendation to buy or sell futures products.”
PAST PERFORMANCE IS NOT NECESSARILY INDICATIVE OF FUTURE RESULTS
IMPORTANT NOTICE! No representation is being made that the use of this strategy or any system or trading methodology will generate profits. Past performance is not necessarily indicative of future results. There is substantial risk of loss associated with trading securities and options on equities. Only risk capital should be used to trade. Trading securities is not suitable for everyone.
Disclaimer: Futures, Options, and Currency trading all have large potential rewards, but they also have large potential risk. You must be aware of the risks and be willing to accept them in order to invest in these markets. Don’t trade with money you can’t afford to lose.
This website is neither a solicitation nor an offer to Buy/Sell futures, options, or currencies. No representation is being made that any account will or is likely to achieve profits or losses similar to those discussed on this web site. The past performance of any trading system or methodology is not necessarily indicative of future results.
CFTC RULE 4.41 –HYPOTHETICAL OR SIMULATED PERFORMANCE RESULTS HAVE CERTAIN LIMITATIONS. UNLIKE AN ACTUAL PERFORMANCE RECORD, SIMULATED RESULTS DO NOT REPRESENT ACTUAL TRADING. ALSO, SINCE THE TRADES HAVE NOT BEEN EXECUTED, THE RESULTS MAY HAVE UNDER-OR-OVER COMPENSATED FOR THE IMPACT, IF ANY, OF CERTAIN MARKET FACTORS, SUCH AS LACK OF LIQUIDITY. SIMULATED TRADING PROGRAMS IN GENERAL ARE ALSO SUBJECT TO THE FACT THAT THEY ARE DESIGNED WITH THE BENEFIT OF HINDSIGHT. NO REPRESENTATION IS BEING MADE THAT ANY ACCOUNT WILL OR IS LIKELY TO ACHIEVE PROFIT OR LOSSES SIMILAR TO THOSE SHOWN