
Markets (Top Stories)

Source: SeekingAlpha.com
Economic Calendar
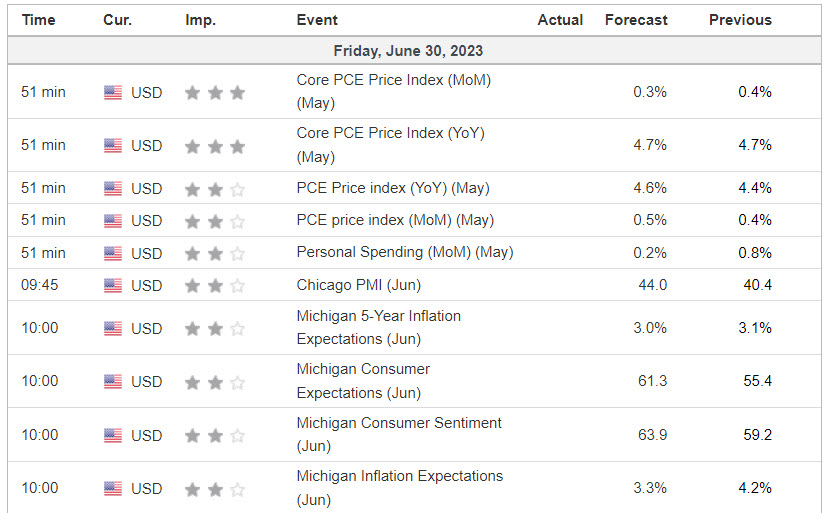
https://www.investing.com/economic-calendar/
S&P 500

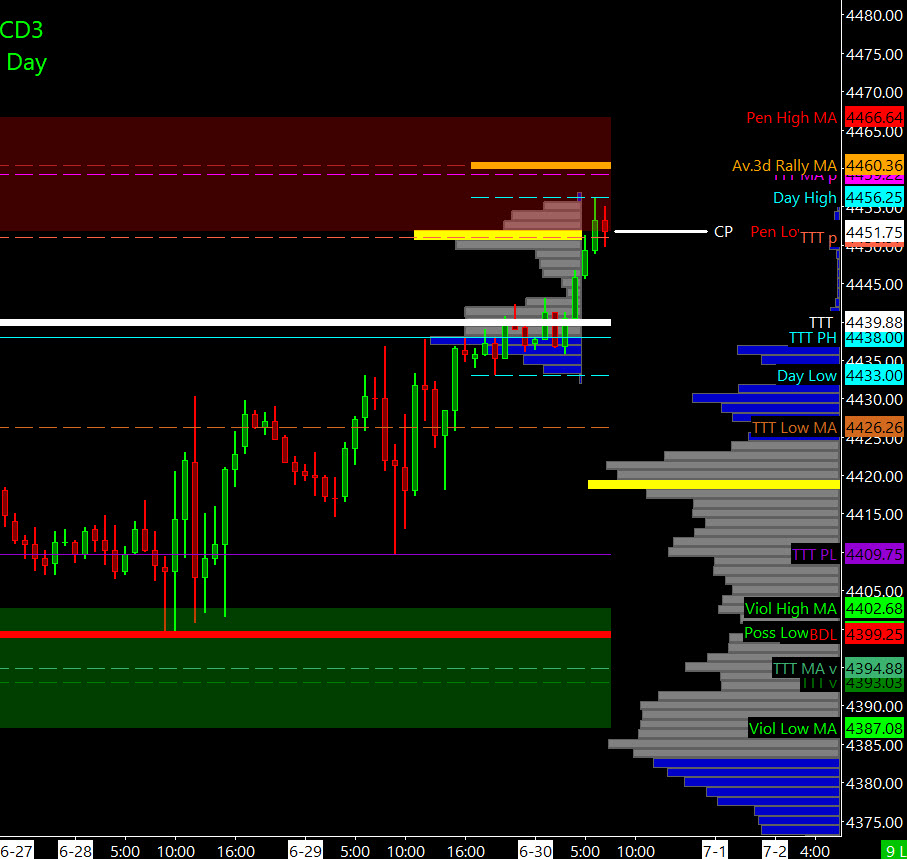
Prior Session was Cycle Day 2 (CD2): Normal CD2 as price tested and held key LIS (4420), consolidated throughout the session and closed near high of the day. Textbook Cycle Day 2. Prior range was 28 handles on 1.620M contracts exchanged.
…Transition from Cycle Day 2 to Cycle Day 3
This leads us into Cycle Day 3 (CD3): Price is extending this cycle’s rally for the EOM/EOQ “window-dressing”, fulfilling our upside target zone 4445 – 4450, which we have been broadcasting as the objective to finish the week. As such, estimated scenarios to consider for today’s trading.
*****The 3 Day Cycle has a 91% probability of fulfilling Positive Cycle Statistics covering 12 years of recorded tracking history.
Bull Scenario: Price sustains a bid above 4435, initially targets 4455 – 4460 zone.
Bear Scenario: Price sustains an offer below 4435, initially targets 4425 – 4420 zone.
PVA High Edge = 4432 PVA Low Edge = 4418 Prior POC = 4430
Range Projections and Key Levels (ES) Sept 2023 (U) Contract
HOD ATR Range Projection: 4477; LOD ATR Range Projection: 4412; 3 Day Central Pivot: 4416; 3 Day Cycle Target: 4460; 10 Day Average True Range 45; VIX: 13
Nasdaq 100 (NQ)

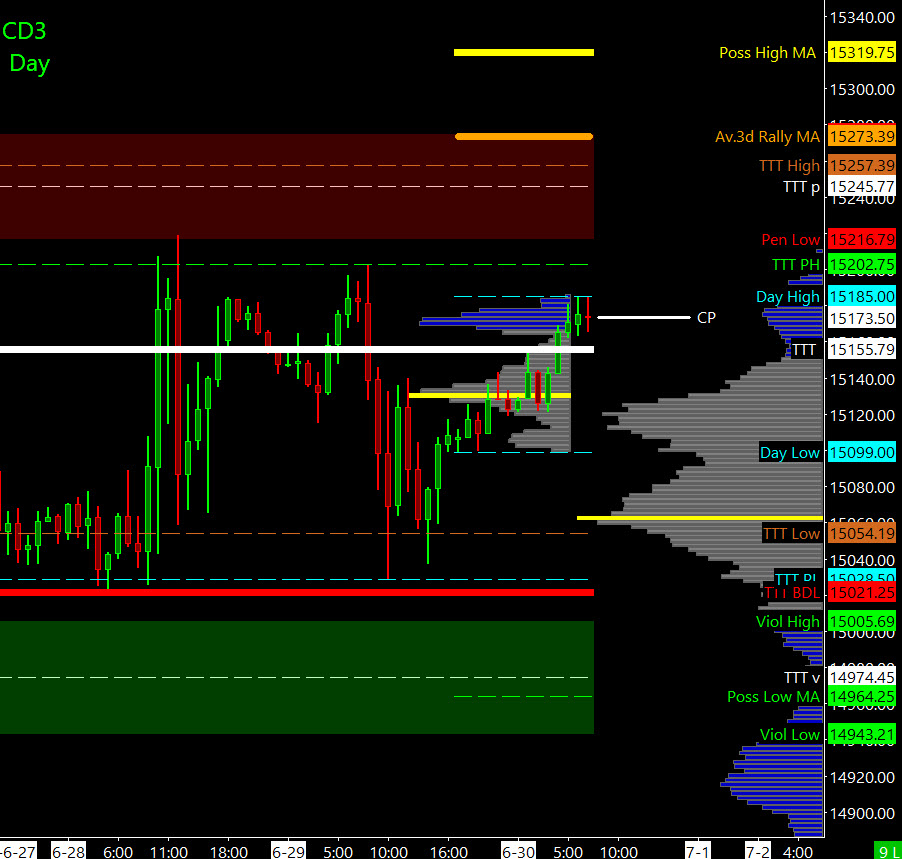
Prior Session was Cycle Day 2 (CD2): Normal CD2 as price held key support (15025), consolidated throughout the session and closed with a firm bid. Textbook Cycle Day 2. Prior range was 174 handles on 585k contracts exchanged.
…Transition from Cycle Day 2 to Cycle Day 3
This leads us into Cycle Day 3 (CD3): Price is trending higher in pre-RTH activity, challenging PH (15202). Positive 3-Day Cycle is secured as EOM/EOQ “window-dressing” is expected to be today’s main driver ahead of the long 4th of July holiday weekend. As such, estimated scenarios to consider for today’s trading.
*****The 3 Day Cycle has a 91% probability of fulfilling Positive Cycle Statistics covering 12 years of recorded tracking history.
Bull Scenario: IF Bulls sustains bid above 15105, THEN initial upside estimate targets 15180– 15200 zone.
Bear Scenario: IF Bears sustains offer below 15105, THEN initial downside estimate targets 15050 – 15030 zone.
PVA High Edge = 15129 PVA Low Edge = 15065 Prior POC = 15112
Range Projections and Key Levels (NQ) Sept 2023 (U) Contract
HOD ATR Range Projection: 15352; LOD ATR Range Projection: 14931; 3 Day Central Pivot: 15092; 3 Day Cycle Target: 15273; 10 Day Average True Range: 254; VIX: 13
Trade Strategy: Our tactical trade strategy will simply remain unaltered…We’ll be flexible to trade both long and short side from Decision Pivot Levels. Continue to focus on Bull/Bear Stackers and Premium/Discounts. As always, remaining in alignment with dominant intra-day force increases probabilities of producing winning trades.
Stay Focused…Non-Biased…Disciplined ALWAYS USE STOPS!
Good Trading…David
“Knowing is not enough, We must APPLY. Willing is not enough, We must DO.” –Bruce Lee
*****This trade strategy report is disseminated for “education only” and should not be viewed in any way as a recommendation to buy or sell futures products.”
PAST PERFORMANCE IS NOT NECESSARILY INDICATIVE OF FUTURE RESULTS
IMPORTANT NOTICE! No representation is being made that the use of this strategy or any system or trading methodology will generate profits. Past performance is not necessarily indicative of future results. There is substantial risk of loss associated with trading securities and options on equities. Only risk capital should be used to trade. Trading securities is not suitable for everyone.
Disclaimer: Futures, Options, and Currency trading all have large potential rewards, but they also have large potential risk. You must be aware of the risks and be willing to accept them in order to invest in these markets. Don’t trade with money you can’t afford to lose.
This website is neither a solicitation nor an offer to Buy/Sell futures, options, or currencies. No representation is being made that any account will or is likely to achieve profits or losses similar to those discussed on this web site. The past performance of any trading system or methodology is not necessarily indicative of future results.
CFTC RULE 4.41 –HYPOTHETICAL OR SIMULATED PERFORMANCE RESULTS HAVE CERTAIN LIMITATIONS. UNLIKE AN ACTUAL PERFORMANCE RECORD, SIMULATED RESULTS DO NOT REPRESENT ACTUAL TRADING. ALSO, SINCE THE TRADES HAVE NOT BEEN EXECUTED, THE RESULTS MAY HAVE UNDER-OR-OVER COMPENSATED FOR THE IMPACT, IF ANY, OF CERTAIN MARKET FACTORS, SUCH AS LACK OF LIQUIDITY. SIMULATED TRADING PROGRAMS IN GENERAL ARE ALSO SUBJECT TO THE FACT THAT THEY ARE DESIGNED WITH THE BENEFIT OF HINDSIGHT. NO REPRESENTATION IS BEING MADE THAT ANY ACCOUNT WILL OR IS LIKELY TO ACHIEVE PROFIT OR LOSSES SIMILAR TO THOSE SHOWN