
Markets

Source: Seeking Alpha
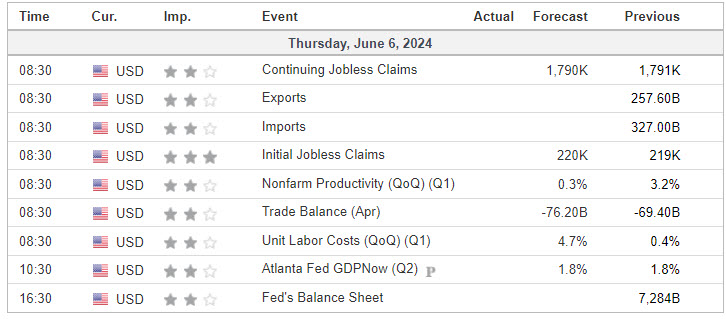
Economic Calendar
S&P 500

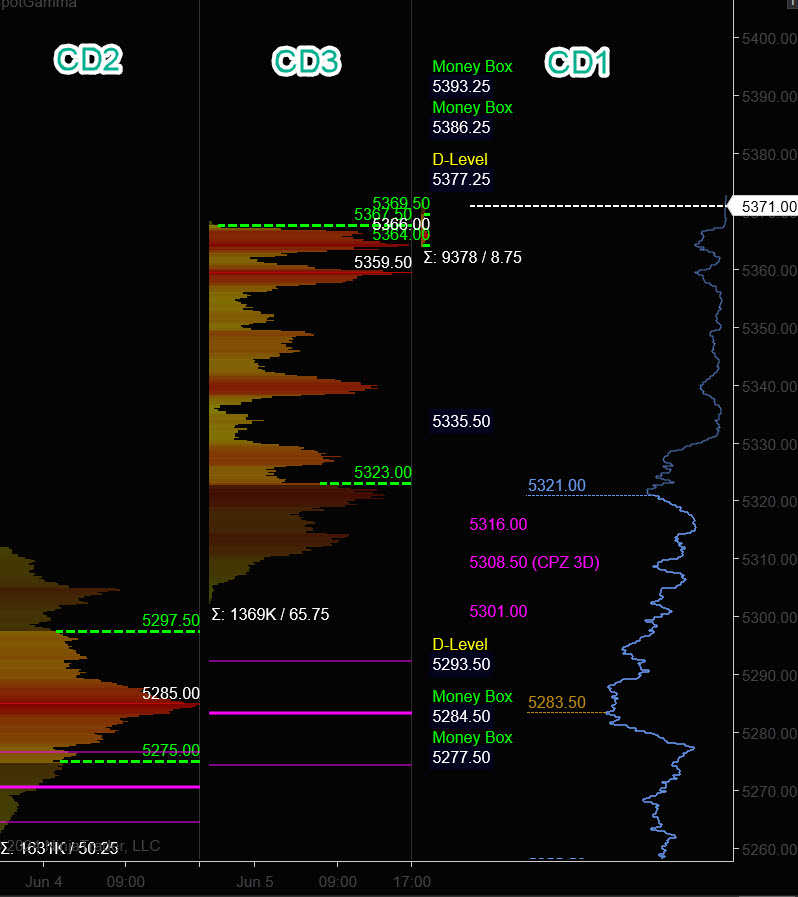
Prior Session was Cycle Day 3: Monster 3 Day Cycle Rally hitting Statistical Range Extremes. To give some perspective on the strength of this Cycle: Price rallied 175.70% of the expected 3 Day Cycle Range (69.15 pts). Actual Range was 121.50 pts. SUPER CYCLE! Daily Range for ES was 65 handles on 1.369M contracts exchanged.
…Transition from Cycle Day 3 to Cycle Day 1
This leads us into Cycle Day 1: Bullish momentum is clearly intact at all-time highs, with Nvidia (NVDA) vaulting > 5% to $3 trillion market valuation, eclipsing Apple (AAPL) for the top spot.
Normal for Cycle Day 1 would be for a decline measuring 5333.50. Residual bullish momentum may spill-over into this session before the next decline begins. Our discipline of maintaining positioning that is aligned with market forces continues to serve us well, so stay the course.
As such, scenarios to consider for today’s trading.
Bull Scenario: Price sustains a bid above 5365, initially targets 5380 – 5385 zone.
Bear Scenario: Price sustains an offer below 5365, initially targets 5350 – 5345 zone.
PVA High Edge = 5367 PVA Low Edge = 5323 Prior POC = 5360
PTG 3 Day Cycle
EXCLUSIVE OFFER

*****The 3 Day Cycle has a 91.89% probability of fulfilling Positive Cycle Statistics covering 12 years of recorded tracking history.
Range Projections (ES) June 2024 (M)
- BULL ATR Range Projection >>> 5425
- BEAR ATR Range Projection >>> 5312
Nasdaq 100 (NQ)

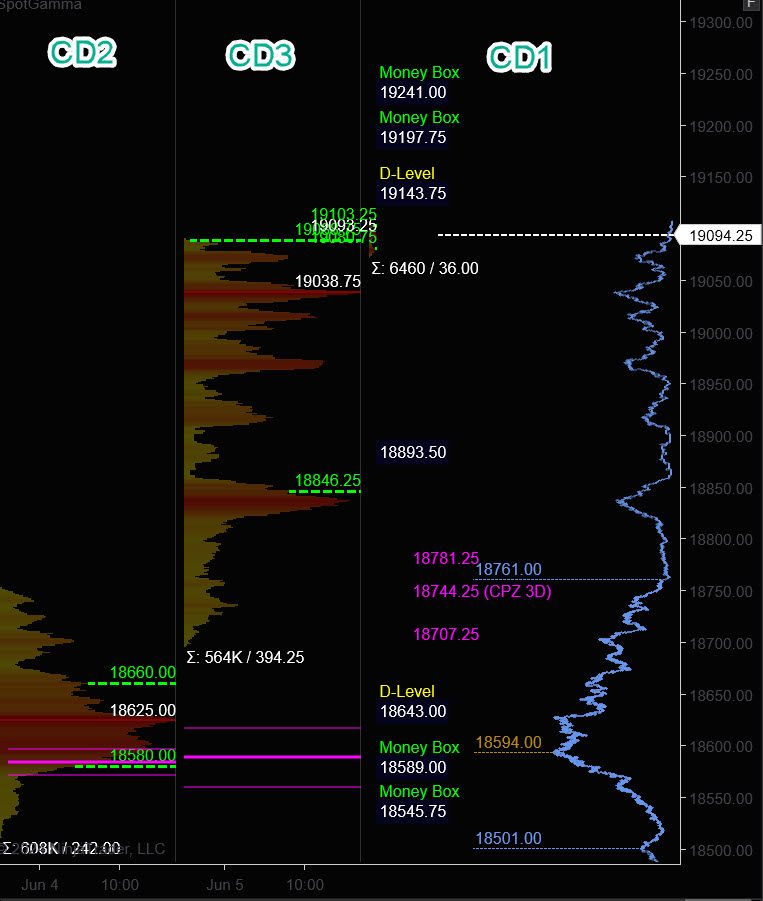
Prior Session was Cycle Day 3: Monster 3 Day Cycle Rally hitting Statistical Range Extremes. Nvidia (NVDA) vaulted > 5% to $5 trillion market valuation, eclipsing Apple (AAPL) for the top spot. Daily Range for NQ was 394 handles on 564k contracts exchanged.
…Transition from Cycle Day 3 to Cycle Day 1
This leads us into Cycle Day 1: Normal for Cycle Day 1 would be for a decline measuring 18973.50. Residual bullish momentum may spill-over into this session before the next decline begins. Our discipline of maintaining positioning that is aligned with market forces continues to serve us well, so stay the course.
Bull Scenario: Price sustains a bid above 19040, initially targets 19130 – 19170 zone.
Bear Scenario: Price sustains an offer below 19040, initially targets 18990 – 18970 zone.
PVA High Edge = 19088 PVA Low Edge = 18846 Prior POC = 19038
Range Projections (NQ) June 2024 (M)
- BULL ATR Range Projection >>> 19358
- BEAR ATR Range Projection >>> 18821
Trade Strategy: Our tactical trade strategy will simply remain unaltered…We’ll be flexible to trade both long and short side from Decision Pivot Levels. Continue to focus on Bull/Bear Stackers and Premium/Discounts. As always, remaining in alignment with dominant intra-day force increases probabilities of producing winning trades.
Stay Focused…Non-Biased…Disciplined ALWAYS USE STOPS!
Good Trading…David
“Knowing is not enough, We must APPLY. Willing is not enough, We must DO.” –BR
*****This trade strategy report is disseminated for “education only” and should not be viewed in any way as a recommendation to buy or sell futures products.”
PAST PERFORMANCE IS NOT NECESSARILY INDICATIVE OF FUTURE RESULTS
IMPORTANT NOTICE! No representation is being made that the use of this strategy or any system or trading methodology will generate profits. Past performance is not necessarily indicative of future results. There is substantial risk of loss associated with trading securities and options on equities. Only risk capital should be used to trade. Trading securities is not suitable for everyone.
Disclaimer: Futures, Options, and Currency trading all have large potential rewards, but they also have large potential risk. You must be aware of the risks and be willing to accept them in order to invest in these markets. Don’t trade with money you can’t afford to lose.
This website is neither a solicitation nor an offer to Buy/Sell futures, options, or currencies. No representation is being made that any account will or is likely to achieve profits or losses similar to those discussed on this web site. The past performance of any trading system or methodology is not necessarily indicative of future results.
CFTC RULE 4.41 –HYPOTHETICAL OR SIMULATED PERFORMANCE RESULTS HAVE CERTAIN LIMITATIONS. UNLIKE AN ACTUAL PERFORMANCE RECORD, SIMULATED RESULTS DO NOT REPRESENT ACTUAL TRADING. ALSO, SINCE THE TRADES HAVE NOT BEEN EXECUTED, THE RESULTS MAY HAVE UNDER-OR-OVER COMPENSATED FOR THE IMPACT, IF ANY, OF CERTAIN MARKET FACTORS, SUCH AS LACK OF LIQUIDITY. SIMULATED TRADING PROGRAMS IN GENERAL ARE ALSO SUBJECT TO THE FACT THAT THEY ARE DESIGNED WITH THE BENEFIT OF HINDSIGHT. NO REPRESENTATION IS BEING MADE THAT ANY ACCOUNT WILL OR IS LIKELY TO ACHIEVE PROFIT OR LOSSES SIMILAR TO THOSE SHOWN