
Markets (Top Stories)

It’s official! The S&P 500’s (SP500) longest bear market since the 1940s has come to an end. The benchmark index closed up 0.6% to 4,294 on Thursday, vaulting it back into bull territory with a 20% advance from its October low. The rally has been powered, in large part, because of a handful of companies posting outsized gains, like Big Tech, Tesla (TSLA) and AI darling Nvidia (NVDA). There has also been somewhat of a resurgence in economic optimism, compared to the sentiment that plagued the market in 2022.
Source: SeekingAlpha.com
Economic Calendar
10:00 Quarterly Services Survey
1:00 PM Baker Hughes Rig Count
https://www.investing.com/economic-calendar/
S&P 500

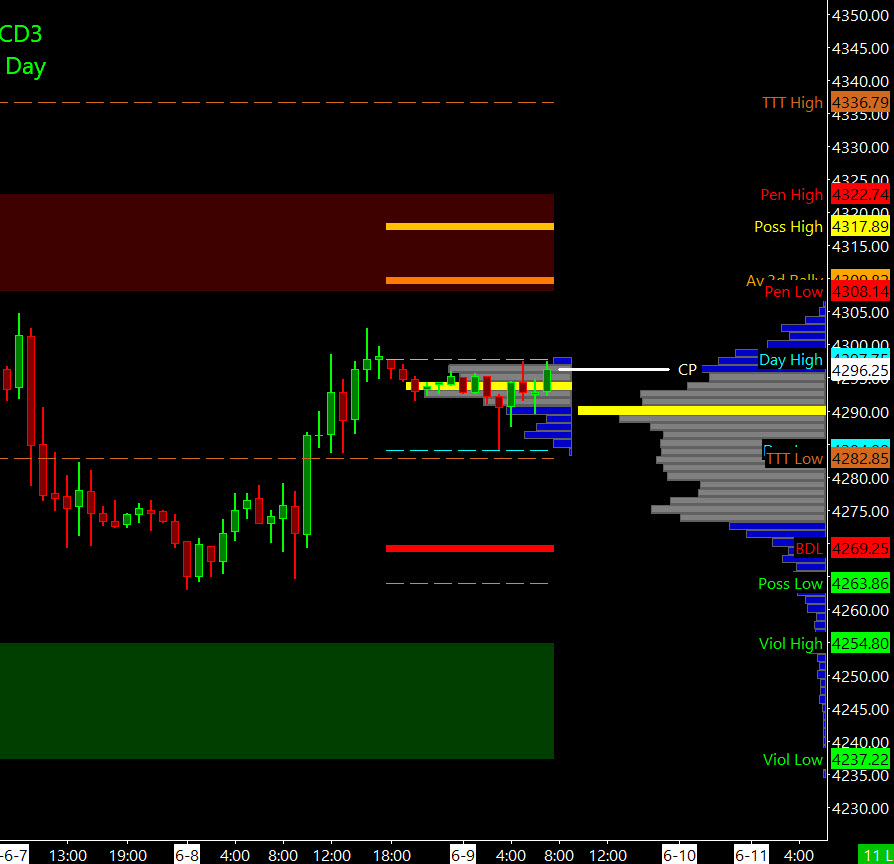
Prior Session was Cycle Day 2 (CD2): Price rallied fulfilling 4300 – 4305 zone objective. Prior range was 40 handles on 1.459M contracts exchanged.
…Transition from Cycle Day 2 to Cycle Day 3
This leads us into Cycle Day 3 (CD3): Cycle Statistic is in-place…As such we’ll mark today as a “wild-card” for direction. Line-in-Sand shifts to 4290 as bulls have control and cannot fumble the ball. As such, estimated scenarios to consider for today’s trading.
Bull Scenario: Price sustains a bid above 4290, initially targets 4310 – 4315 zone.
Bear Scenario: Price sustains an offer below 4290, initially targets 4275 – 4270 zone.
PVA High Edge = 4300 PVA Low Edge = 4275 Prior POC = 4295
Range Projections and Key Levels (ES) June 2023 (M) Contract
HOD ATR Range Projection: 4332; LOD ATR Range Projection: 4250; 3 Day Central Pivot: 4285; 3 Day Cycle Target: 4310; 10 Day Average True Range 48; VIX: 13
Nasdaq 100 (NQ)

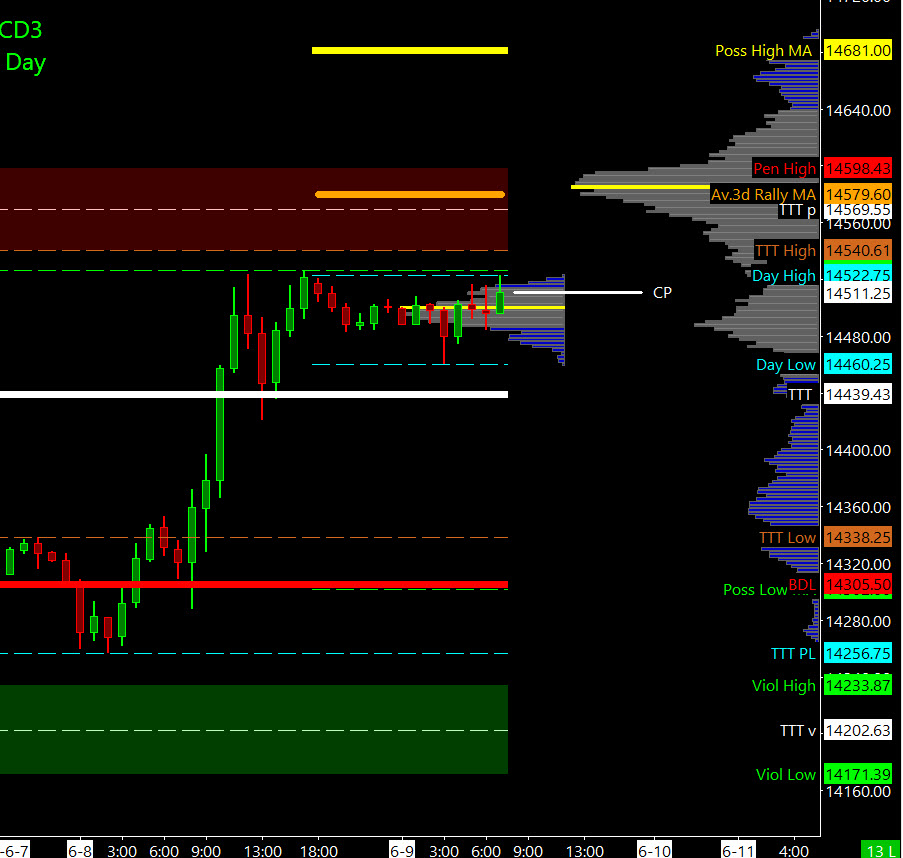
Prior Session was Cycle Day 2 (CD2): Price rallied fulfilling 14500 – 14520 zone objective. Prior range was 270 handles on 610k contracts exchanged.
…Transition from Cycle Day 2 to Cycle Day 3
This leads us into Cycle Day 3 (CD3): Cycle Statistic is in-place…As such we’ll mark today as a “wild-card” for direction. Line-in-Sand shifts to 14500 as bulls have control and cannot fumble the ball. As such, estimated scenarios to consider for today’s trading.
Bull Scenario: IF Bulls sustains bid above 14500, THEN initial upside estimate targets 14575– 14600 zone.
Bear Scenario: IF Bears sustains offer below 14500, THEN initial downside estimate targets 14465 – 14460 zone.
PVA High Edge = 14512 PVA Low Edge = 14366 Prior POC = 14486
Range Projections and Key Levels (NQ) June 2023 (M) Contract
HOD ATR Range Projection: 14722; LOD ATR Range Projection: 14259; 3 Day Central Pivot: 14480; 3 Day Cycle Target: 14579; 10 Day Average True Range: 262; VIX: 13
Trade Strategy: Our tactical trade strategy will simply remain unaltered…We’ll be flexible to trade both long and short side from Decision Pivot Levels. Continue to focus on Bull/Bear Stackers and Premium/Discounts. As always, remaining in alignment with dominant intra-day force increases probabilities of producing winning trades.
Stay Focused…Non-Biased…Disciplined ALWAYS USE STOPS!
Good Trading…David
“Knowing is not enough, We must APPLY. Willing is not enough, We must DO.” –Bruce Lee
*****This trade strategy report is disseminated for “education only” and should not be viewed in any way as a recommendation to buy or sell futures products.”
PAST PERFORMANCE IS NOT NECESSARILY INDICATIVE OF FUTURE RESULTS
IMPORTANT NOTICE! No representation is being made that the use of this strategy or any system or trading methodology will generate profits. Past performance is not necessarily indicative of future results. There is substantial risk of loss associated with trading securities and options on equities. Only risk capital should be used to trade. Trading securities is not suitable for everyone.
Disclaimer: Futures, Options, and Currency trading all have large potential rewards, but they also have large potential risk. You must be aware of the risks and be willing to accept them in order to invest in these markets. Don’t trade with money you can’t afford to lose.
This website is neither a solicitation nor an offer to Buy/Sell futures, options, or currencies. No representation is being made that any account will or is likely to achieve profits or losses similar to those discussed on this web site. The past performance of any trading system or methodology is not necessarily indicative of future results.
CFTC RULE 4.41 –HYPOTHETICAL OR SIMULATED PERFORMANCE RESULTS HAVE CERTAIN LIMITATIONS. UNLIKE AN ACTUAL PERFORMANCE RECORD, SIMULATED RESULTS DO NOT REPRESENT ACTUAL TRADING. ALSO, SINCE THE TRADES HAVE NOT BEEN EXECUTED, THE RESULTS MAY HAVE UNDER-OR-OVER COMPENSATED FOR THE IMPACT, IF ANY, OF CERTAIN MARKET FACTORS, SUCH AS LACK OF LIQUIDITY. SIMULATED TRADING PROGRAMS IN GENERAL ARE ALSO SUBJECT TO THE FACT THAT THEY ARE DESIGNED WITH THE BENEFIT OF HINDSIGHT. NO REPRESENTATION IS BEING MADE THAT ANY ACCOUNT WILL OR IS LIKELY TO ACHIEVE PROFIT OR LOSSES SIMILAR TO THOSE SHOWN