
Markets
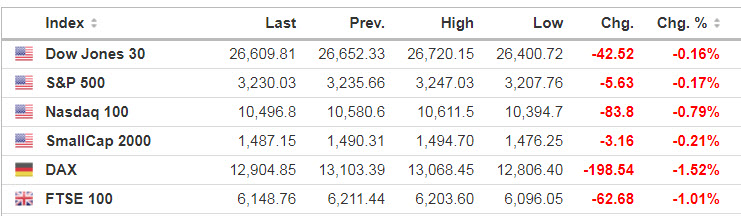
Tech is under more pressure today with Nasdaq futures down 1.1%, while contracts tied to the Dow and S&P 500 are off 0.4%, as tensions rise between Beijing and Washington. Another rebound of business activity across the eurozone didn’t help markets there as the Euro Stoxx 50 fell 1.6%.
Source: Seeking Alpha https://seekingalpha.com/
Source: https://www.investing.com/indices/indices-cfds
Economic Calendar
9:45 PMI Composite Flash
10:00 New Home Sales
1:00 PM Baker-Hughes Rig Count
Source: https://www.investing.com/economic-calendar/
S&P 500 (ES)
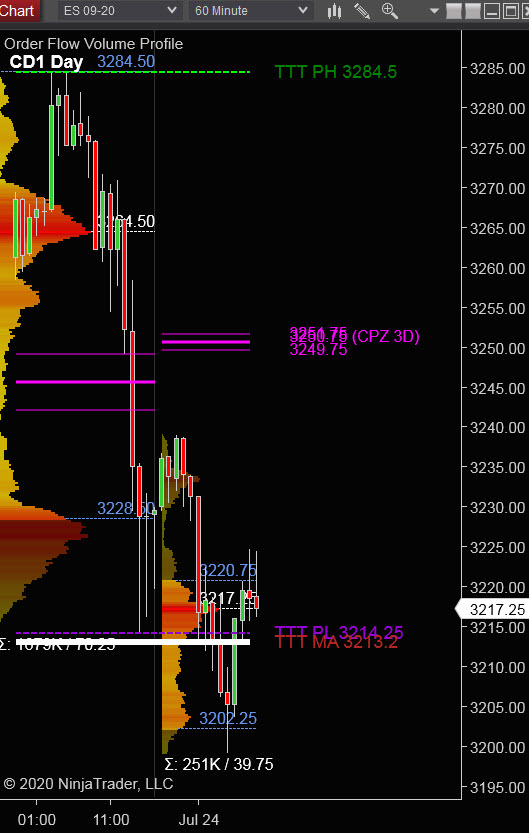
Prior Session was Cycle Day 3 (CD3): Positive 3 Day Cycle as price pushed above CD2 24 hr high but failed to sustain a bid during GLOBEX Session. Price again attempted and failed to clear CD2 RTH high, at which time probabilities shifted in favor of a developing decline. Violation of key 3250 level accelerated the decline driving price down to lows of session. Range for session was 70.25 handles.
…Transition from Cycle Day 3 to Cycle Day 1
This leads us into Cycle Day 1 (CD1): Average Decline for CD1 (71.50) is in-place at 3213. As such, we have two scenarios to consider for today’s trading.
1.) Price sustains a bid above 3213, initially targeting 3223 – 3233 zone.
2.) Price sustains an offer below 3213, initially targeting 3200 – 3195 zone.
P -VA High = 3285 P – VA Low = 3228 P – POC = 3265
Range Projections and Key Levels (ES) September 2020 (U) Contract
HOD ATR Range Projection: 3261; LOD ATR Range Projection: 3237; 3 Day Central Pivot: 3250; 10 Day Average True Range 48; VIX: 27
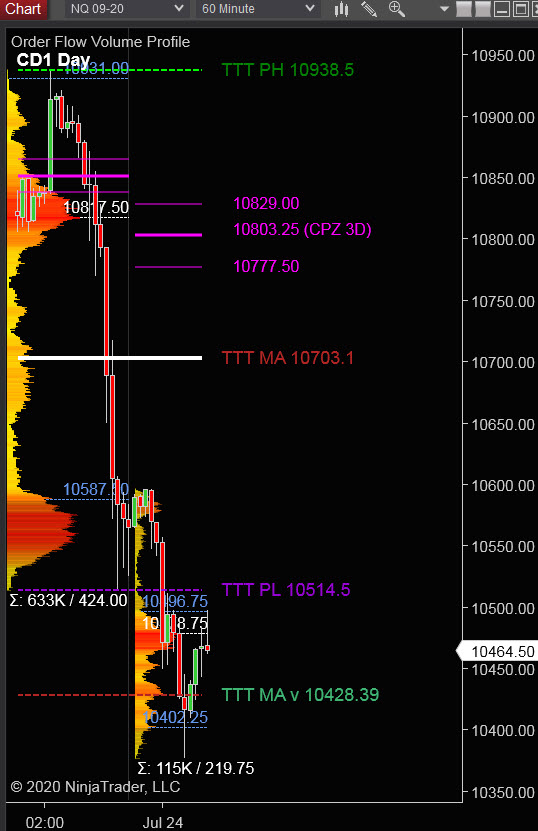
Nasdaq 100 (NQ)
Today is Cycle Day 1 (CD1)… Price failed to clear CD2 high increasing odds of a decline as a weak technology sector has come under increased selling pressure into earning season. Range for the session was 424 handles, two-thirds of the normalized 10-day average range. As such we have two scenarios to consider for today’s trading.
P – VA High = 10932 P – VA Low = 10588 P – POC = 10816
Bull Scenario: IF Bulls hold bid above 10515, THEN initial upside estimate targets 10565 – 10590 zone.
Bear Scenario: IF Bears hold offer below 10515, THEN initial downside estimate targets 10428 – 10372 zone.
Range Projections and Key Levels (NQ) September 2020 (U) Contract
HOD ATR Range Projection: 10766; LOD ATR Range Projection: 10686; 3 Day Central Pivot: 10804; 10 Day Average True Range: 252; VIX: 27
Trade Strategy: Our tactical trade strategy will simply remain unaltered…We’ll be flexible to trade both long and short side from Decision Pivot Levels. Continue to focus on Bull/Bear Stackers and Premium/Discounts. As always, remaining in alignment with dominant intra-day force increases probabilities of producing winning trades.
Stay Focused…Non-Biased…Disciplined ALWAYS USE STOPS!
Good Trading…David
“Knowing is not enough, We must APPLY. Willing is not enough, We must DO.” –Bruce Lee
*****This trade strategy report is disseminated for “education only” and should not be viewed in any way as a recommendation to buy or sell futures products.”
PAST PERFORMANCE IS NOT NECESSARILY INDICATIVE OF FUTURE RESULTS
IMPORTANT NOTICE! No representation is being made that the use of this strategy or any system or trading methodology will generate profits. Past performance is not necessarily indicative of future results. There is substantial risk of loss associated with trading securities and options on equities. Only risk capital should be used to trade. Trading securities is not suitable for everyone.
Disclaimer: Futures, Options, and Currency trading all have large potential rewards, but they also have large potential risk. You must be aware of the risks and be willing to accept them in order to invest in these markets. Don’t trade with money you can’t afford to lose.
This website is neither a solicitation nor an offer to Buy/Sell futures, options, or currencies. No representation is being made that any account will or is likely to achieve profits or losses similar to those discussed on this web site. The past performance of any trading system or methodology is not necessarily indicative of future results.
CFTC RULE 4.41 –HYPOTHETICAL OR SIMULATED PERFORMANCE RESULTS HAVE CERTAIN LIMITATIONS. UNLIKE AN ACTUAL PERFORMANCE RECORD, SIMULATED RESULTS DO NOT REPRESENT ACTUAL TRADING. ALSO, SINCE THE TRADES HAVE NOT BEEN EXECUTED, THE RESULTS MAY HAVE UNDER-OR-OVER COMPENSATED FOR THE IMPACT, IF ANY, OF CERTAIN MARKET FACTORS, SUCH AS LACK OF LIQUIDITY. SIMULATED TRADING PROGRAMS IN GENERAL ARE ALSO SUBJECT TO THE FACT THAT THEY ARE DESIGNED WITH THE BENEFIT OF HINDSIGHT. NO REPRESENTATION IS BEING MADE THAT ANY ACCOUNT WILL OR IS LIKELY TO ACHIEVE PROFIT OR LOSSES SIMILAR TO THOSE SHOWN