
Markets
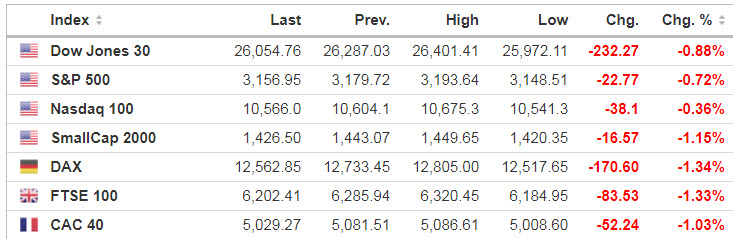
Stocks were mixed in Asia overnight, while Europe is down 1.3% as the European Commission cut the region’s economic forecasts for 2020 and 2021. Over in the U.S., S&P 500 futures have paused their strong rally, off 0.8% in early trade following a gain of 1.6% on Monday.
Source: SeekingAlpha.com
Economic Calendar
8:55 Redbook Chain Store Sales
9:00 Fed’s Bostic Speech
10:00 Job Openings and Labor Turnover Survey
https://www.investing.com/economic-calendar/
***New: PTG Trading Room Chat Log’s Link
S&P 500
Prior Session was Cycle Day 2 (CD2): It was a normal CD2 session as price consolidated throughout the session, though Breadth as measured by Advance/Decline Ratio was negatively divergent throughout the session.
…Transition from Cycle Day 2 to Cycle Day 3
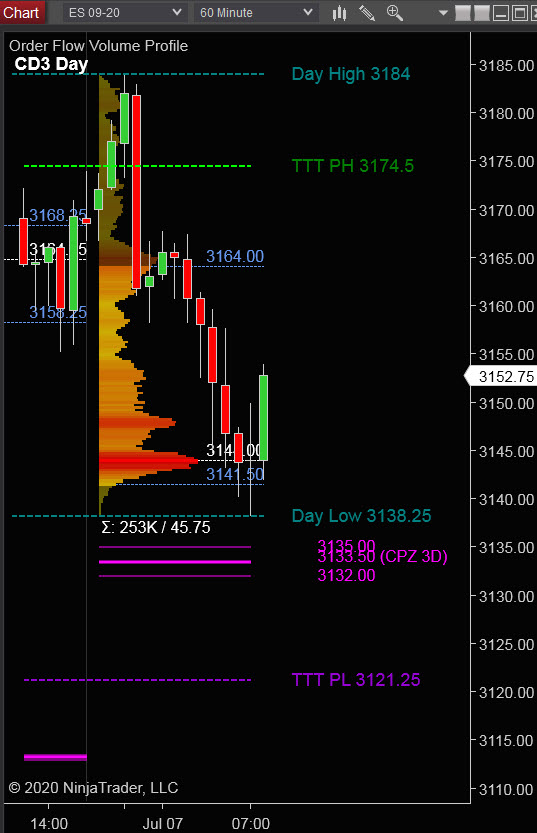
This leads us into Cycle Day 3 (CD3): Price traded above prior high (3174.50) during Asian Session but quickly reversed direction for remainder of GLOBEX, currently trading near low (3138.25). As such, we have two scenarios to consider for today’s session:
1.) Price sustains a bid above 3145, initially targeting 3155 – 3165 zone.
2.) Price sustains an offer below 3145 initially targeting 3140 – 3135 zone.
*****3 Day Cycle has a 91% probability of fulfilling Positive Statistic covering 12 years of recorded tracking history.
PVA High Edge = 3168 PVA Low Edge = 3158 Prior POC = 3165
Range Projections and Key Levels (ES) September 2020 (U) Contract
HOD ATR Range Projection: 3176; LOD ATR Range Projection: 3120; 3 Day Central Pivot: 3133; 3 Day Cycle Target: 3213; 10 Day Average True Range 55; VIX: 28.50
Nasdaq 100 (NQ)
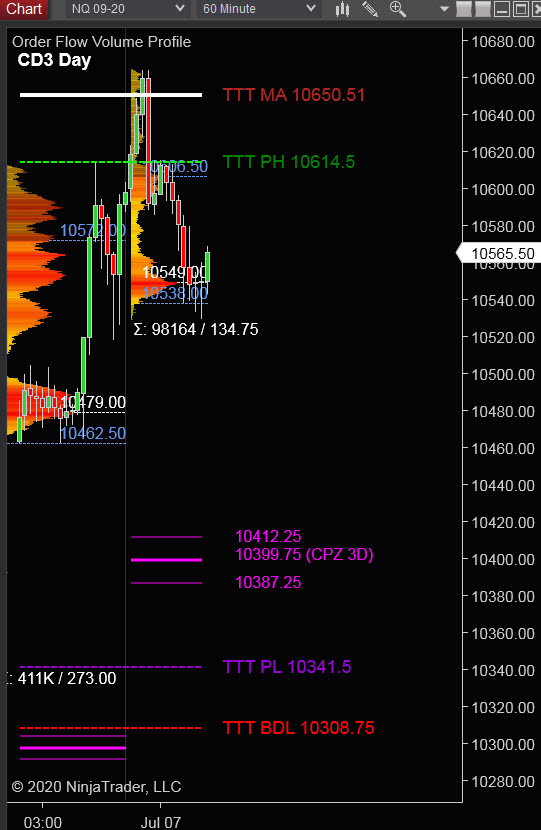
Today is Cycle Day 3 (CD3)…Price pushed above prior high (10614.50) and fulfilled 10650.50 3 Day Cycle Target, before reversing back below prior high pushing down to 10530. As such, we have two scenarios to consider for today’s session:
PVA High Edge = 10573 PVA Low Edge = 10463 Prior POC = 10480
Bull Scenario: IF Bulls sustain a bid above 10550, THEN initial upside estimate targets 10580 – 10600 zone.
Bear Scenario: IF Bears sustain an offer below 10550, THEN initial downside estimate targets 10530 – 10500 zone.
Range Projections and Key Levels (NQ) September 2020 (U) Contract
HOD ATR Range Projection: 10535; LOD ATR Range Projection: 10420; 3 Day Central Pivot: 10400; 3 Day Cycle Target: 10650; 10 Day Average True Range: 194; VIX: 28.50
Trade Strategy: Our tactical trade strategy will simply remain unaltered…We’ll be flexible to trade both long and short side from Decision Pivot Levels. Continue to focus on Bull/Bear Stackers and Premium/Discounts. As always, remaining in alignment with dominant intra-day force increases probabilities of producing winning trades.
Stay Focused…Non-Biased…Disciplined ALWAYS USE STOPS!
Good Trading…David
“Knowing is not enough, We must APPLY. Willing is not enough, We must DO.” –Bruce Lee
*****This trade strategy report is disseminated for “education only” and should not be viewed in any way as a recommendation to buy or sell futures products.”
PAST PERFORMANCE IS NOT NECESSARILY INDICATIVE OF FUTURE RESULTS
IMPORTANT NOTICE! No representation is being made that the use of this strategy or any system or trading methodology will generate profits. Past performance is not necessarily indicative of future results. There is substantial risk of loss associated with trading securities and options on equities. Only risk capital should be used to trade. Trading securities is not suitable for everyone.
Disclaimer: Futures, Options, and Currency trading all have large potential rewards, but they also have large potential risk. You must be aware of the risks and be willing to accept them in order to invest in these markets. Don’t trade with money you can’t afford to lose.
This website is neither a solicitation nor an offer to Buy/Sell futures, options, or currencies. No representation is being made that any account will or is likely to achieve profits or losses similar to those discussed on this web site. The past performance of any trading system or methodology is not necessarily indicative of future results.
CFTC RULE 4.41 –HYPOTHETICAL OR SIMULATED PERFORMANCE RESULTS HAVE CERTAIN LIMITATIONS. UNLIKE AN ACTUAL PERFORMANCE RECORD, SIMULATED RESULTS DO NOT REPRESENT ACTUAL TRADING. ALSO, SINCE THE TRADES HAVE NOT BEEN EXECUTED, THE RESULTS MAY HAVE UNDER-OR-OVER COMPENSATED FOR THE IMPACT, IF ANY, OF CERTAIN MARKET FACTORS, SUCH AS LACK OF LIQUIDITY. SIMULATED TRADING PROGRAMS IN GENERAL ARE ALSO SUBJECT TO THE FACT THAT THEY ARE DESIGNED WITH THE BENEFIT OF HINDSIGHT. NO REPRESENTATION IS BEING MADE THAT ANY ACCOUNT WILL OR IS LIKELY TO ACHIEVE PROFIT OR LOSSES SIMILAR TO THOSE SHOWN