
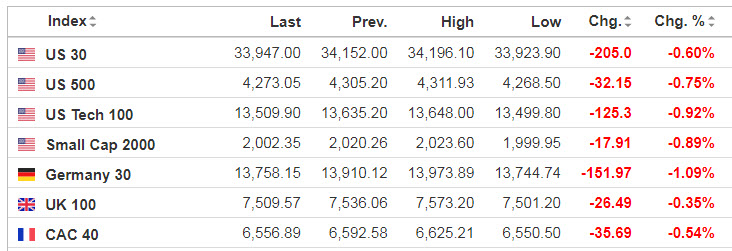
Markets
It’s hard to find a week where the Fed won’t steal the spotlight. Later today, the markets will get a more detailed view of what was discussed at the Federal Reserve’s July 26-27 meeting, when the FOMC raised its policy rate by 75 basis points for a second-straight meeting, as it struggles to bring inflation under control.
Fed minutes arrive at 2 p.m. ET.
Source: SeekingAlpha.com
Economic Calendar
8:30 Retail Sales
9:30 Fed’s Bowman Speech
10:00 Business Inventories
1:00 PM Results of $15B, 20-Year Bond Auction
2:00 PM FOMC Minutes
2:20 PM Fed’s Bowman Speech
https://www.investing.com/economic-calendar/
***New: PTG Trading Room Chat Log’s Link

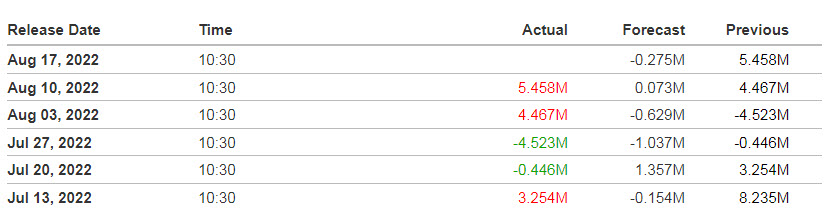
10:30 EIA Petroleum Inventories
U.S. crude inventories fell by 448,000 barrels for the week ended Aug. 12. That compared with a build of 2.2 million barrels reported by the API for the previous week. Economists were expecting an increase of about 117,000 barrels.
The official government inventory report due Wednesday is expected to show weekly U.S. crude supplies fell by about 275,000 barrels last week.
S&P 500

***Written Tuesday evening for Wednesday’s trading for contribution to MrTopStep’s “The Opening Print” publication.
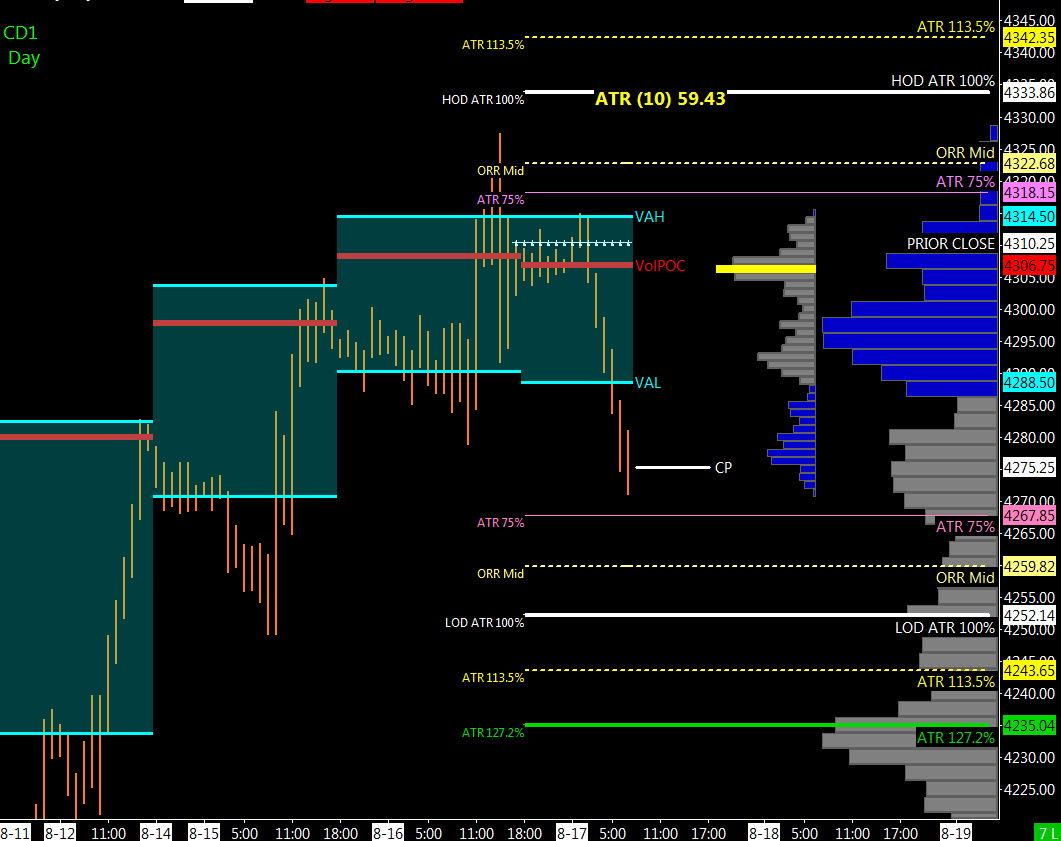
Prior Session was Cycle Day 3 (CD3): Markets continued to rally fulfilling 3 Day Cycle Target (4322) at which time price reversed direction, reverting back to 4300 Strike Zone. Prior range was 49 handles (below average of 64 ) on 1.319M contracts exchanged.
…Transition from Cycle Day 3 to Cycle Day 1
This leads us into Cycle Day 1 (CD1): Normal for CD1 is some magnitude decline, with the average measuring 4250, though with OPEX being influential this week, price may remain “sticky” around the 4300 Strike Price Zone. As such, estimated scenarios to consider for today’s trading.
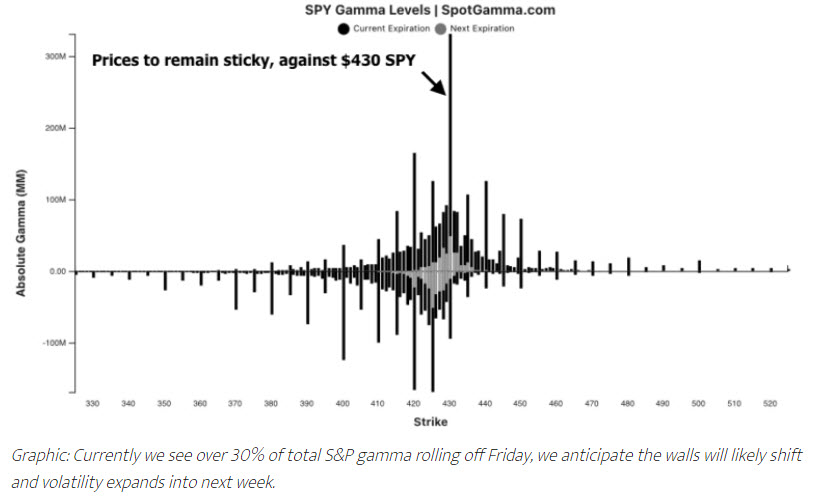 Source: spotgamma.com
Bull Scenario: Price sustains a bid above 4300, initially targets 4315 – 4320 zone.
Bear Scenario: Price sustains an offer below 4300, initially targets 4270 – 4265 zone.
PVA High Edge = 4314 PVA Low Edge = 4291 Prior POC = 4308
*****The 3 Day Cycle has a 91% probability of fulfilling Positive Cycle Statistics covering 12 years of recorded tracking history.
For more detailed information for both bullish and bearish projected targets, please visit: PTG 3 Day Cycle and/or reference the Cycle Spreadsheet below:
Link to access full Cycle Spreadsheet > > Cycle Day 1 (CD1)
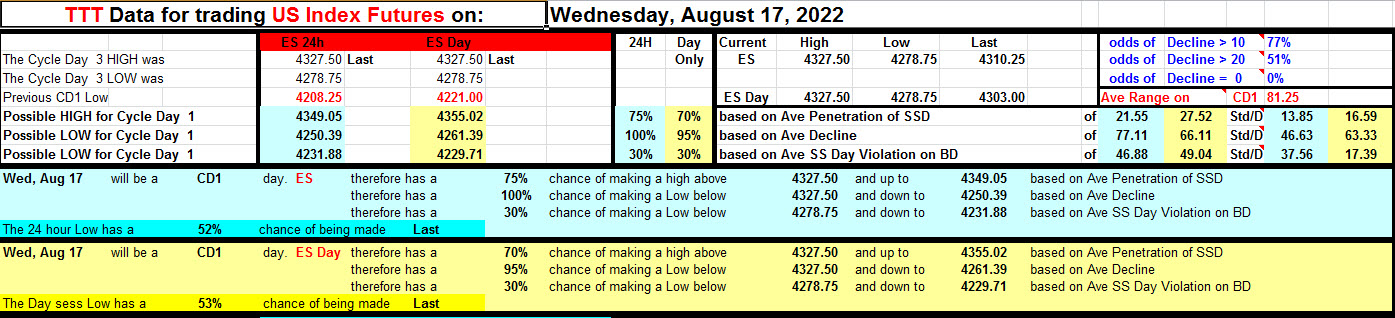
Range Projections and Key Levels (ES) Sept 2022 (U) Contract
HOD ATR Range Projection: 4333; LOD ATR Range Projection: 4252; 3 Day Central Pivot: 4282; 3 Day Cycle Target: 4352; 10 Day Average True Range 62; VIX: 20
Nasdaq 100 (NQ)

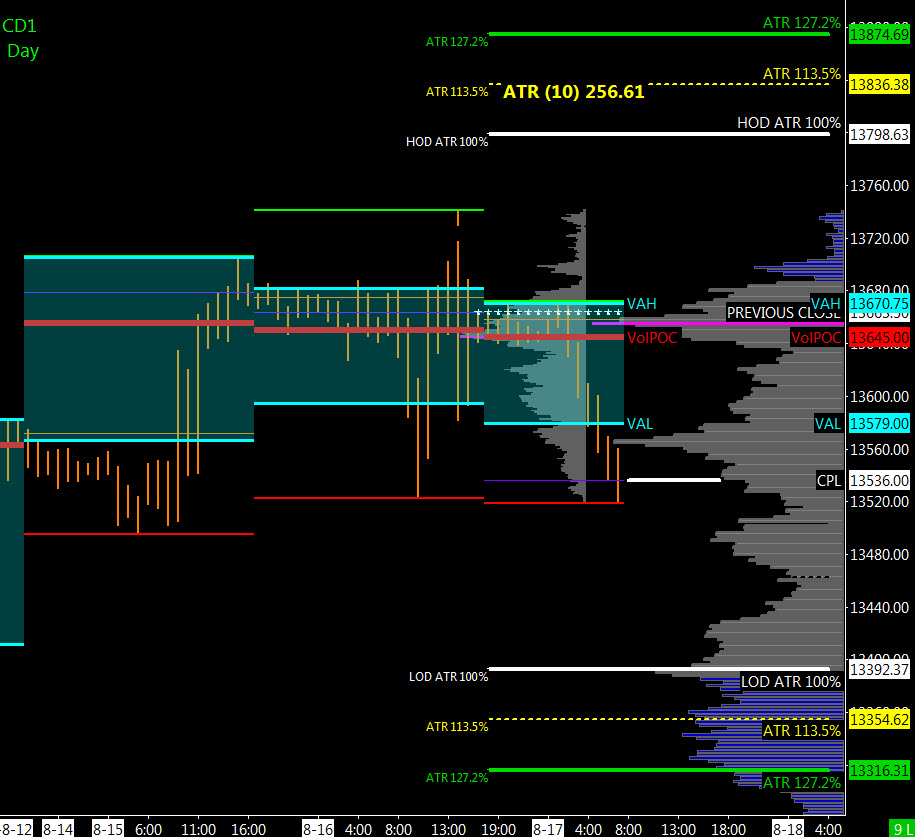
Today is Cycle Day 1 (CD1)…Normal for CD1 is for some magnitude decline, with the average measuring 13434. Prior range was 218 handles on 550k contracts ts exchanged. As such, there are two estimated scenarios to consider for today’s trading.
Bull Scenario: IF Bulls sustains bid above 13640, THEN initial upside estimate targets 13685 – 13705 zone.
Bear Scenario: IF Bears sustains offer below 13640, THEN initial downside estimate targets 13345 – 13325 zone.
PVA High Edge = 13681 PVA Low Edge = 12596 Prior POC = 13646
Range Projections and Key Levels (NQ) Sept 2022 (U) Contract
HOD ATR Range Projection: 13809; LOD ATR Range Projection: 13382; 3 Day Central Pivot: 13587; 3 Day Cycle Target: 13639; 10 Day Average True Range: 290; VIX: 20
Trade Strategy: Our tactical trade strategy will simply remain unaltered…We’ll be flexible to trade both long and short side from Decision Pivot Levels. Continue to focus on Bull/Bear Stackers and Premium/Discounts. As always, remaining in alignment with dominant intra-day force increases probabilities of producing winning trades.
Stay Focused…Non-Biased…Disciplined ALWAYS USE STOPS!
Good Trading…David
“Knowing is not enough, We must APPLY. Willing is not enough, We must DO.” –Bruce Lee
*****This trade strategy report is disseminated for “education only” and should not be viewed in any way as a recommendation to buy or sell futures products.”
PAST PERFORMANCE IS NOT NECESSARILY INDICATIVE OF FUTURE RESULTS
IMPORTANT NOTICE! No representation is being made that the use of this strategy or any system or trading methodology will generate profits. Past performance is not necessarily indicative of future results. There is substantial risk of loss associated with trading securities and options on equities. Only risk capital should be used to trade. Trading securities is not suitable for everyone.
Disclaimer: Futures, Options, and Currency trading all have large potential rewards, but they also have large potential risk. You must be aware of the risks and be willing to accept them in order to invest in these markets. Don’t trade with money you can’t afford to lose.
This website is neither a solicitation nor an offer to Buy/Sell futures, options, or currencies. No representation is being made that any account will or is likely to achieve profits or losses similar to those discussed on this web site. The past performance of any trading system or methodology is not necessarily indicative of future results.
CFTC RULE 4.41 –HYPOTHETICAL OR SIMULATED PERFORMANCE RESULTS HAVE CERTAIN LIMITATIONS. UNLIKE AN ACTUAL PERFORMANCE RECORD, SIMULATED RESULTS DO NOT REPRESENT ACTUAL TRADING. ALSO, SINCE THE TRADES HAVE NOT BEEN EXECUTED, THE RESULTS MAY HAVE UNDER-OR-OVER COMPENSATED FOR THE IMPACT, IF ANY, OF CERTAIN MARKET FACTORS, SUCH AS LACK OF LIQUIDITY. SIMULATED TRADING PROGRAMS IN GENERAL ARE ALSO SUBJECT TO THE FACT THAT THEY ARE DESIGNED WITH THE BENEFIT OF HINDSIGHT. NO REPRESENTATION IS BEING MADE THAT ANY ACCOUNT WILL OR IS LIKELY TO ACHIEVE PROFIT OR LOSSES SIMILAR TO THOSE SHOWN