
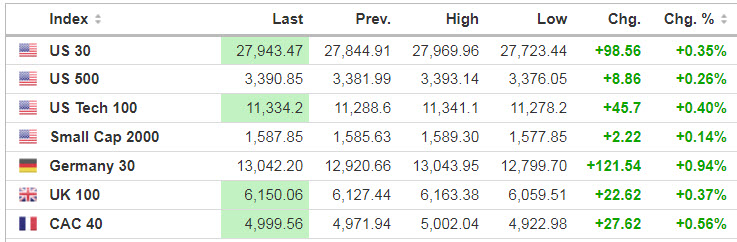
Markets
S&P and Dow futures are roughly flat while Nasdaq futures +0.28%. 10-year Treasury yield slips almost 2 basis points to 0.68%. Gold gains 0.09% to $2,002.80 per ounce; crude oil up 0.42% to $43.07 per barrel. In Hong Kong the Hang Seng Index closes up 0.08% and Japan’s Nikkei 225 Index fell 0.2%
Source: SeekingAlpha.com
Economic Calendar
8:30 Housing Starts
8:55 Redbook Chain Store Sales
10:00 E-Commerce Retail Sales
https://www.investing.com/economic-calendar/
***New: PTG Trading Room Chat Log’s Link
S&P 500
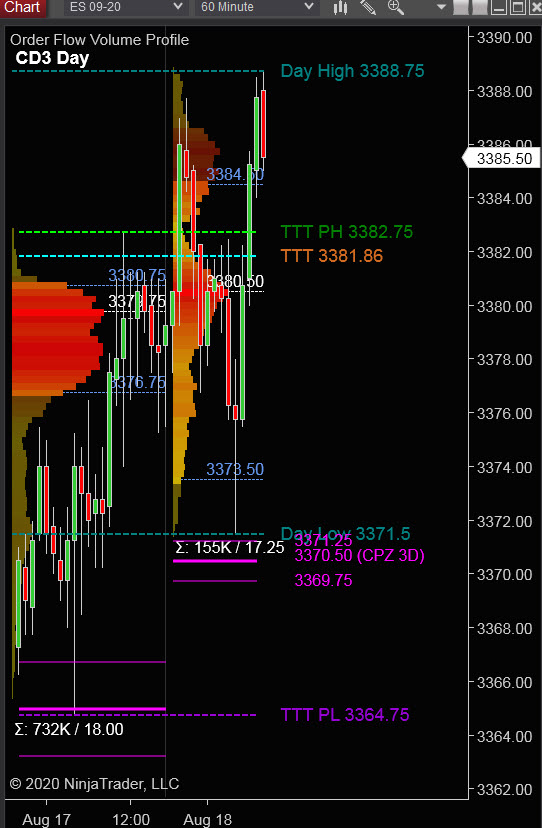
Prior Session was Cycle Day 2 (CD2): Normal CD2 as price held bullish gap and consolidated between 3375 – 3380 throughout the RTH Session. Range was 8.75 handles on 558K contracts traded. One of the slowest trading session this year.
…Transition from Cycle Day 2 to Cycle Day 3
This leads us into Cycle Day 3 (CD3): Price has cleared & converted 3380 level. Bulls will need to sustain a bid, while a violation opens the door to a deeper decline. We have two scenarios to consider for today’s trading.
1.) Price sustains a bid above 3380, initially targeting 3388 – 3393 zone.
2.) Price sustains an offer below 3380, initially targeting 3375 – 3370 zone.
*****3 Day Cycle has a 91% probability of fulfilling Positive Statistic covering 12 years of recorded tracking history.
PVA High Edge = 3381 PVA Low Edge = 3376 Prior POC = 3380
Range Projections and Key Levels (ES) September 2020 (U) Contract
HOD ATR Range Projection: 3396; LOD ATR Range Projection: 3352; 3 Day Central Pivot: 3370; 3 Day Cycle Target: 3382; 10 Day Average True Range 32; VIX: 21
Nasdaq 100 (NQ)
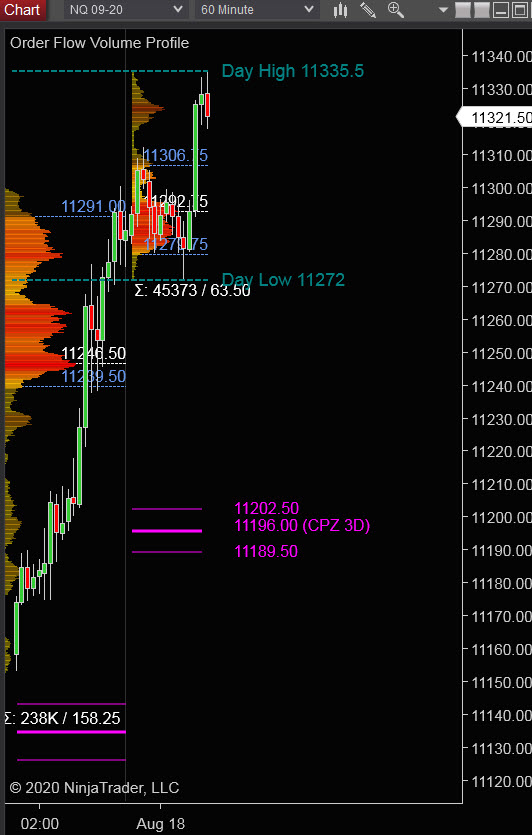
Today is Cycle Day 3 (CD3)…Price has yet again pushed higher to new all-time high, seemingly a daily event for Tech Sec. Today we have two scenarios to consider:
PVA High Edge = 11291 PVA Low Edge = 11240 Prior POC = 11247
Bull Scenario: IF Bulls sustain a bid above 11280, THEN initial upside estimate targets 11322 – 11344 zone.
Bear Scenario: IF Bears sustain an offer below 11280, THEN initial downside estimate targets 11260 – 11240 zone.
Range Projections and Key Levels (NQ) September 2020 (U) Contract
HOD ATR Range Projection: 11321; LOD ATR Range Projection: 11121; 3 Day Central Pivot: 11196; 3 Day Cycle Target: 11428; 10 Day Average True Range: 179; VIX: 21
Trade Strategy: Our tactical trade strategy will simply remain unaltered…We’ll be flexible to trade both long and short side from Decision Pivot Levels. Continue to focus on Bull/Bear Stackers and Premium/Discounts. As always, remaining in alignment with dominant intra-day force increases probabilities of producing winning trades.
Stay Focused…Non-Biased…Disciplined ALWAYS USE STOPS!
Good Trading…David
“Knowing is not enough, We must APPLY. Willing is not enough, We must DO.” –Bruce Lee
*****This trade strategy report is disseminated for “education only” and should not be viewed in any way as a recommendation to buy or sell futures products.”
PAST PERFORMANCE IS NOT NECESSARILY INDICATIVE OF FUTURE RESULTS
IMPORTANT NOTICE! No representation is being made that the use of this strategy or any system or trading methodology will generate profits. Past performance is not necessarily indicative of future results. There is substantial risk of loss associated with trading securities and options on equities. Only risk capital should be used to trade. Trading securities is not suitable for everyone.
Disclaimer: Futures, Options, and Currency trading all have large potential rewards, but they also have large potential risk. You must be aware of the risks and be willing to accept them in order to invest in these markets. Don’t trade with money you can’t afford to lose.
This website is neither a solicitation nor an offer to Buy/Sell futures, options, or currencies. No representation is being made that any account will or is likely to achieve profits or losses similar to those discussed on this web site. The past performance of any trading system or methodology is not necessarily indicative of future results.
CFTC RULE 4.41 –HYPOTHETICAL OR SIMULATED PERFORMANCE RESULTS HAVE CERTAIN LIMITATIONS. UNLIKE AN ACTUAL PERFORMANCE RECORD, SIMULATED RESULTS DO NOT REPRESENT ACTUAL TRADING. ALSO, SINCE THE TRADES HAVE NOT BEEN EXECUTED, THE RESULTS MAY HAVE UNDER-OR-OVER COMPENSATED FOR THE IMPACT, IF ANY, OF CERTAIN MARKET FACTORS, SUCH AS LACK OF LIQUIDITY. SIMULATED TRADING PROGRAMS IN GENERAL ARE ALSO SUBJECT TO THE FACT THAT THEY ARE DESIGNED WITH THE BENEFIT OF HINDSIGHT. NO REPRESENTATION IS BEING MADE THAT ANY ACCOUNT WILL OR IS LIKELY TO ACHIEVE PROFIT OR LOSSES SIMILAR TO THOSE SHOWN