
Markets

Source: Financial Juice
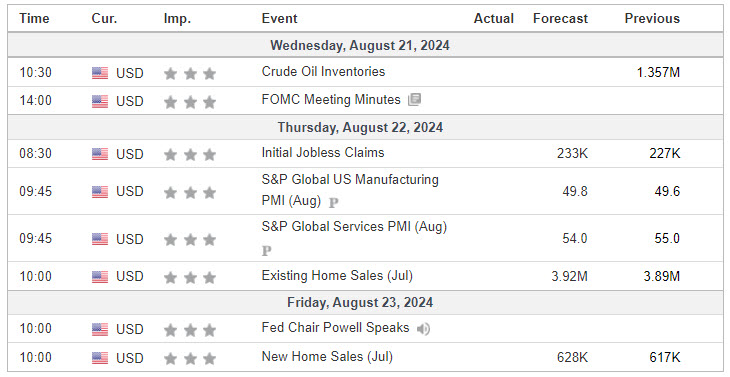
Economic Calendar
S&P 500

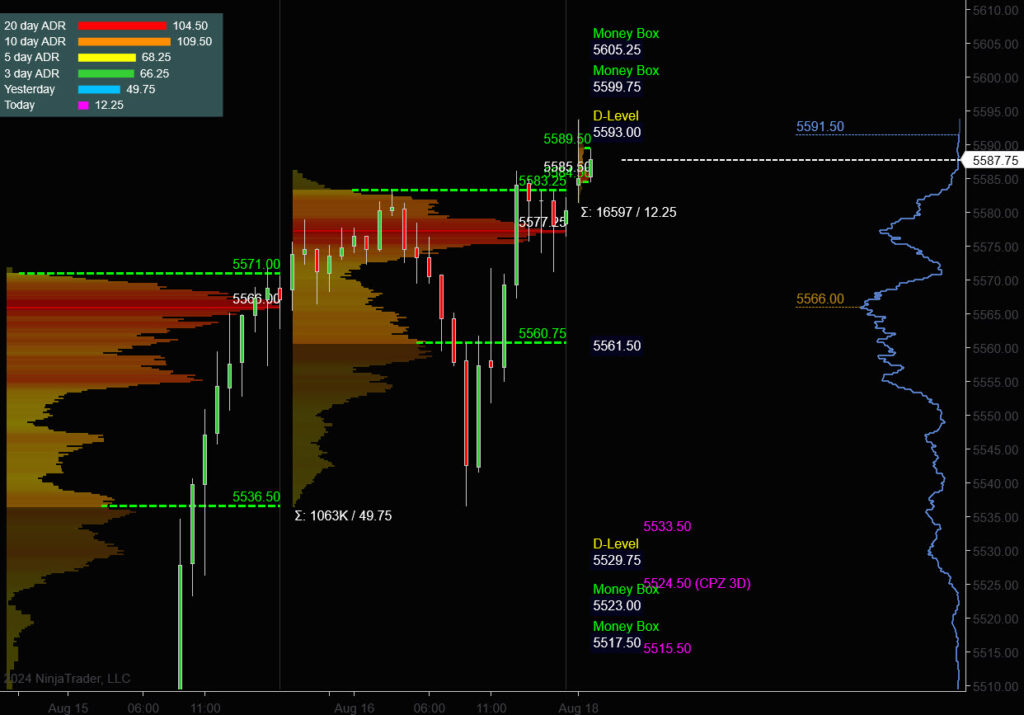
Prior Session was Cycle Day 1: Cycle Day 1 (CD1) was a stunning example of the accuracy of the 3 Day Cycle range projections. Expectation was for a decline, with the historical average measuring 5536.50. Actual Low of the Day was in-fact 5536.50. Not to be undone, the projected upside target for CD1 measured 5585.19. Actual High of the Day was in-fact 5585.75. Range was 49 handles on 1.063M contracts exchanged.

This is not an anomaly…Cycle Range Targets consistently get fulfilled, providing a critical trade edge for the attentive trader following the PTG 3 Day Cycle. Has this peaked your interest in learning more about the 3 Day Cycle? Click the links below to get started with a FREE TRIAL.
PTG 3 Day Cycle
EXCLUSIVE OFFER

…Transition from Cycle Day 1 to Cycle Day 2
This leads us into Cycle Day 2: Market’s are on the “risk-on” offensive having fully recovered the dramatic sell-off, which is quickly becoming a distant-memory. This week’s attention is going to be focused on FOMC Minutes mid-week and JPOW speech at Jackson Hole on Friday.
Price is currently at an interesting Decision Point (DP) where the potential August Pivot High (5600.75) may repel further upside, following seven (7) days of One Time-Framing on the daily charts. Price would need to violate and convert the CD1 Low (5536.50) to lower resistance to shift the current bull dynamic.
As Cycle Day 2 normal expectation is for two-way balancing rhythms; We’ll be framing 5536 – 5585 as the primary consolidating edges. Either side of these levels may indicate a continuation to the upside or a reversal to the downside. As as always, we’ll defer to Mr. Market to be our guide for this session.
Know Thy Plan! Our discipline of maintaining positioning that is aligned with market forces continues to serve us well, so stay the course.
As such, scenarios to consider for today’s trading.
Bull Scenario: Price sustains a bid above 5585, initially targets 5600 – 5605 zone.
Bear Scenario: Price sustains an offer below 5585, initially targets 5565 – 5560 zone.
PVA High Edge = 5461 PVA Low Edge = 5413 Prior POC = 5445
*****The 3 Day Cycle has a 90% probability of fulfilling Positive Cycle Statistics covering 12 years of recorded tracking history.
ES Chart
Nasdaq 100 (NQ)

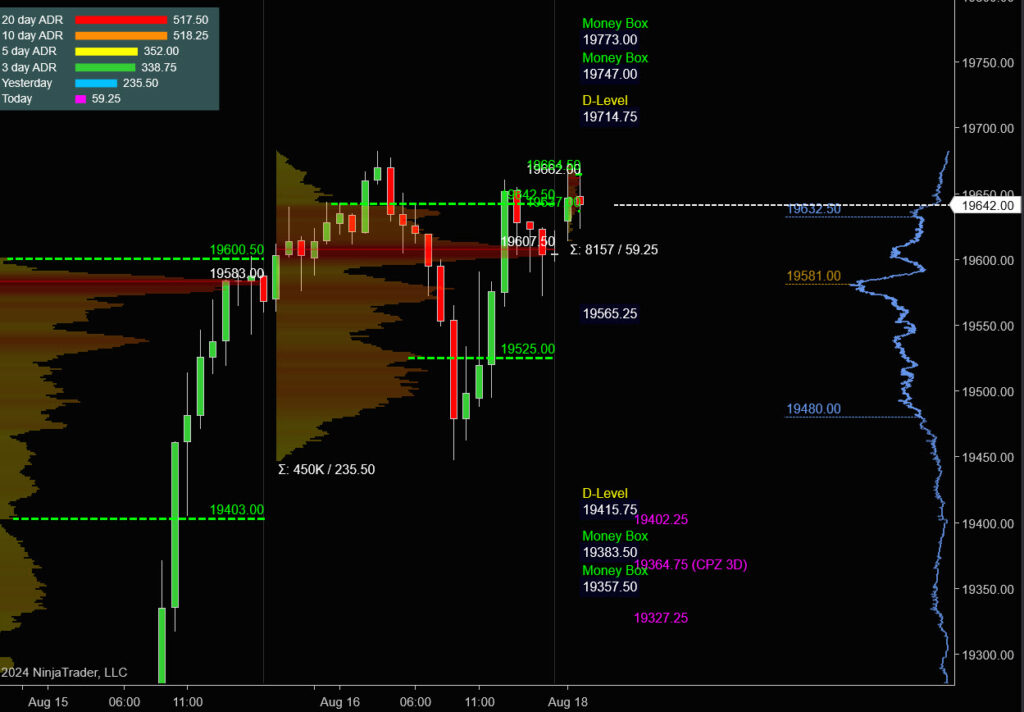
Prior Session was Cycle Day 1: Price continued in uptrend-mode to close out a stunning reversal week challenging the August 1st high pivot. Range was 235 handles on 450k contracts exchanged.
…Transition from Cycle Day 1 to Cycle Day 2
This leads us into Cycle Day 2: Normal expectation is for two-way balancing rhythms; We’ll be framing 19445 – 19683 as the primary consolidating edges. Either side of these levels may indicate a continuation to the upside or a reversal to the downside. As as always, we’ll defer to Mr. Market to be our guide for this session.
Know Thy Plan! Our discipline of maintaining positioning that is aligned with market forces continues to serve us well, so stay the course.
As such, scenarios to consider for today’s trading.
Bull Scenario: Price sustains a bid above 19600, initially targets 19715 – 19735 zone.
Bear Scenario: Price sustains an offer below 19600, initially targets 19525 – 19480 zone.
PVA High Edge = 19642 PVA Low Edge = 19525 Prior POC = 19607
NQ Chart
Trade Strategy: Our tactical trade strategy will simply remain unaltered…We’ll be flexible to trade both long and short side from Decision Pivot Levels. Continue to focus on Bull/Bear Stackers and Premium/Discounts. As always, remaining in alignment with dominant intra-day force increases probabilities of producing winning trades.
Stay Focused…Non-Biased…Disciplined ALWAYS USE STOPS!
Good Trading…David
“Knowing is not enough, We must APPLY. Willing is not enough, We must DO.” –BR
*****This trade strategy report is disseminated for “education only” and should not be viewed in any way as a recommendation to buy or sell futures products.”
PAST PERFORMANCE IS NOT NECESSARILY INDICATIVE OF FUTURE RESULTS
IMPORTANT NOTICE! No representation is being made that the use of this strategy or any system or trading methodology will generate profits. Past performance is not necessarily indicative of future results. There is substantial risk of loss associated with trading securities and options on equities. Only risk capital should be used to trade. Trading securities is not suitable for everyone.
Disclaimer: Futures, Options, and Currency trading all have large potential rewards, but they also have large potential risk. You must be aware of the risks and be willing to accept them in order to invest in these markets. Don’t trade with money you can’t afford to lose.
This website is neither a solicitation nor an offer to Buy/Sell futures, options, or currencies. No representation is being made that any account will or is likely to achieve profits or losses similar to those discussed on this web site. The past performance of any trading system or methodology is not necessarily indicative of future results.
CFTC RULE 4.41 –HYPOTHETICAL OR SIMULATED PERFORMANCE RESULTS HAVE CERTAIN LIMITATIONS. UNLIKE AN ACTUAL PERFORMANCE RECORD, SIMULATED RESULTS DO NOT REPRESENT ACTUAL TRADING. ALSO, SINCE THE TRADES HAVE NOT BEEN EXECUTED, THE RESULTS MAY HAVE UNDER-OR-OVER COMPENSATED FOR THE IMPACT, IF ANY, OF CERTAIN MARKET FACTORS, SUCH AS LACK OF LIQUIDITY. SIMULATED TRADING PROGRAMS IN GENERAL ARE ALSO SUBJECT TO THE FACT THAT THEY ARE DESIGNED WITH THE BENEFIT OF HINDSIGHT. NO REPRESENTATION IS BEING MADE THAT ANY ACCOUNT WILL OR IS LIKELY TO ACHIEVE PROFIT OR LOSSES SIMILAR TO THOSE SHOWN