
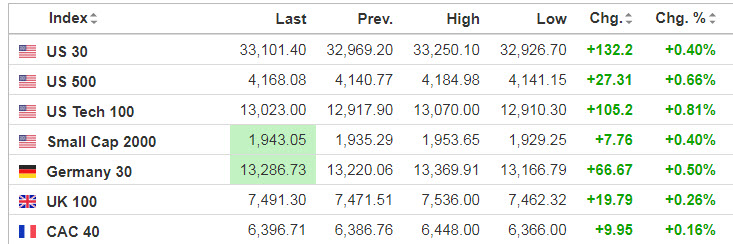
Markets
The bookies are cuing up the spreads for Jackson Hole, and investors are taking note. The annual economic symposium has increased importance this year given the current macro-driven market, as well as the cohesive swings being seen among asset classes like stocks, bonds and commodities.
Source: SeekingAlpha.com
Economic Calendar
Jackson Hole Economic Symposium
8:30 GDP Q2
8:30 Initial Jobless Claims
8:30 Corporate profits
10:30 EIA Natural Gas Inventory
11:00 Kansas City Fed Mfg Survey
1:00 PM Results of $37B, 7-Year Note Auction
4:30 PM Fed Balance Sheet
https://www.investing.com/economic-calendar/
***New: PTG Trading Room Chat Log’s Link
S&P 500

Prior Session was Cycle Day 3 (CD3): Positive 3-Day Cycle, as price continued to consolidate within expected range parameters between 4110 – 4150 as laid out in prior DTS 8.24.22. Range was 47.75 handles on 1.293M contracts exchanged.
…Transition from Cycle Day 3 to Cycle Day 1
This leads us into Cycle Day 1 (CD1): Average Decline for CD1 measures 4272. Markets have a positive bid this morning as Jackson Hole (J-Hole) get underway with Fed Chair Jay Powell (JPOW) is slated to talk on Friday. Expectations vary on market reaction, though currently appears to have a bullish lean. As such, estimated scenarios to consider for today’s trading.
Bull Scenario: Price sustains a bid above 4160, initially targets 4185 – 4190 zone.
Bear Scenario: Price sustains an offer below 4160, initially targets 4140 – 4135 zone.
PVA High Edge = 4147 PVA Low Edge = 4127 Prior POC = 4140
Range Projections and Key Levels (ES) Sept 2022 (U) Contract
HOD ATR Range Projection: 4201; LOD ATR Range Projection: 4130; 3 Day Central Pivot: 4247; 3 Day Cycle Target: 4181; 10 Day Average True Range 58; VIX: 22

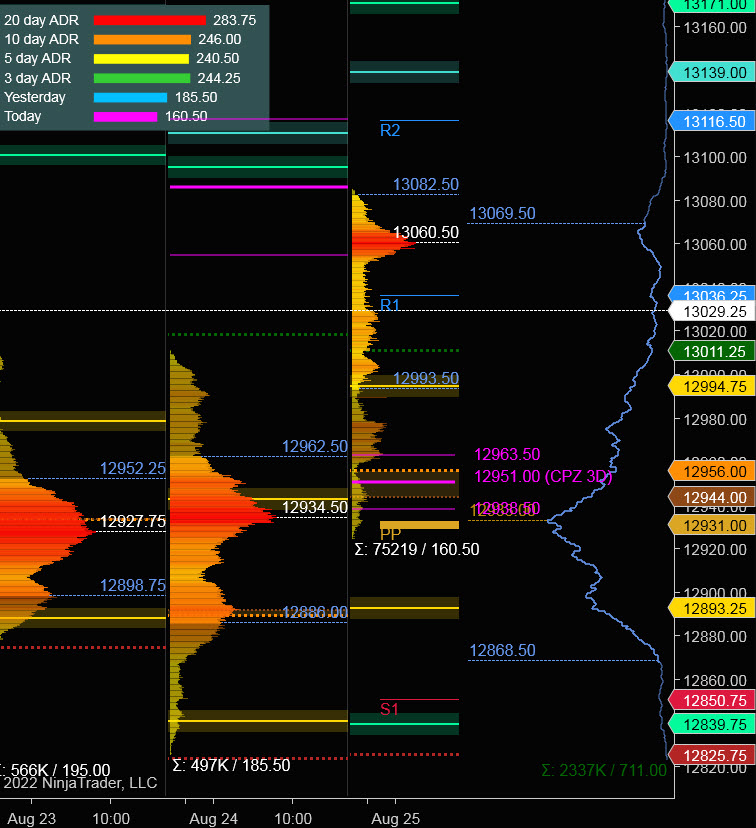
Nasdaq 100 (NQ)

Today is Cycle Day 1 (CD1)…Today is CD1 with Average Decline measuring 12669. Price is currently trading higher by approximately 1% as bullish lean is the current theme ahead of J-Hole. As such, there are two estimated scenarios to consider for today’s trading.
Bull Scenario: IF Bulls sustains bid above 13000, THEN initial upside estimate targets 13170 – 13185 zone.
Bear Scenario: IF Bears sustains offer below 13000, THEN initial downside estimate targets 12950 – 12935 zone.
PVA High Edge = 12963 PVA Low Edge = 12885 Prior POC = 12935
Range Projections and Key Levels (NQ) Sept 2022 (U) Contract
HOD ATR Range Projection: 13175; LOD ATR Range Projection: 12835; 3 Day Central Pivot: 12951; 3 Day Cycle Target: 13235; 10 Day Average True Range: 250; VIX: 22
Trade Strategy: Our tactical trade strategy will simply remain unaltered…We’ll be flexible to trade both long and short side from Decision Pivot Levels. Continue to focus on Bull/Bear Stackers and Premium/Discounts. As always, remaining in alignment with dominant intra-day force increases probabilities of producing winning trades.
Stay Focused…Non-Biased…Disciplined ALWAYS USE STOPS!
Good Trading…David
“Knowing is not enough, We must APPLY. Willing is not enough, We must DO.” –Bruce Lee
*****This trade strategy report is disseminated for “education only” and should not be viewed in any way as a recommendation to buy or sell futures products.”
PAST PERFORMANCE IS NOT NECESSARILY INDICATIVE OF FUTURE RESULTS
IMPORTANT NOTICE! No representation is being made that the use of this strategy or any system or trading methodology will generate profits. Past performance is not necessarily indicative of future results. There is substantial risk of loss associated with trading securities and options on equities. Only risk capital should be used to trade. Trading securities is not suitable for everyone.
Disclaimer: Futures, Options, and Currency trading all have large potential rewards, but they also have large potential risk. You must be aware of the risks and be willing to accept them in order to invest in these markets. Don’t trade with money you can’t afford to lose.
This website is neither a solicitation nor an offer to Buy/Sell futures, options, or currencies. No representation is being made that any account will or is likely to achieve profits or losses similar to those discussed on this web site. The past performance of any trading system or methodology is not necessarily indicative of future results.
CFTC RULE 4.41 –HYPOTHETICAL OR SIMULATED PERFORMANCE RESULTS HAVE CERTAIN LIMITATIONS. UNLIKE AN ACTUAL PERFORMANCE RECORD, SIMULATED RESULTS DO NOT REPRESENT ACTUAL TRADING. ALSO, SINCE THE TRADES HAVE NOT BEEN EXECUTED, THE RESULTS MAY HAVE UNDER-OR-OVER COMPENSATED FOR THE IMPACT, IF ANY, OF CERTAIN MARKET FACTORS, SUCH AS LACK OF LIQUIDITY. SIMULATED TRADING PROGRAMS IN GENERAL ARE ALSO SUBJECT TO THE FACT THAT THEY ARE DESIGNED WITH THE BENEFIT OF HINDSIGHT. NO REPRESENTATION IS BEING MADE THAT ANY ACCOUNT WILL OR IS LIKELY TO ACHIEVE PROFIT OR LOSSES SIMILAR TO THOSE SHOWN