
S&P 500

Prior Session was Cycle Day 3: Three-Day Cycle Statistic (90%) was satisfied as price traded above the Cycle Day 1 Low (5619.75) during the RTH Session. In yesterday’s briefing we noted two KEY Line in the Sand (LIS) levels (5650 – 5630), as a break of either would signal an expansionary directional lean. DTS Briefing 8.28.24 Price violated 5630 first and sparked a cascading selloff which drove price down to the August 22nd low (5582), before recovering back to VWAP, finally settling at 5593.50. Range was 74 handles on 1.307 contracts exchanged.
…Transition from Cycle Day 3 to Cycle Day 1
This leads us into Cycle Day 1: Average Decline for CD1 (5585) has been fulfilled during prior session’s sell-down. Selling momentum may spill over into today’s session, though the next rally could also begin at anytime. We will be looking for a Clear and Convert (CnC) above 5585 handle for green-shoots. As always, we’ll let Mr. Market be our “tour-guide.”
Our discipline of maintaining positioning that is aligned with market forces continues to serve us well, so stay the course.
As such, scenarios to consider for today’s trading.
Bull Scenario: Price sustains a bid above 5585, initially targets 5605 – 5615 zone.
Bear Scenario: Price sustains an offer below 5585, initially targets 5560 – 5557 zone.
PVA High Edge = 5624 PVA Low Edge = 5583 Prior POC = 5607
ES Chart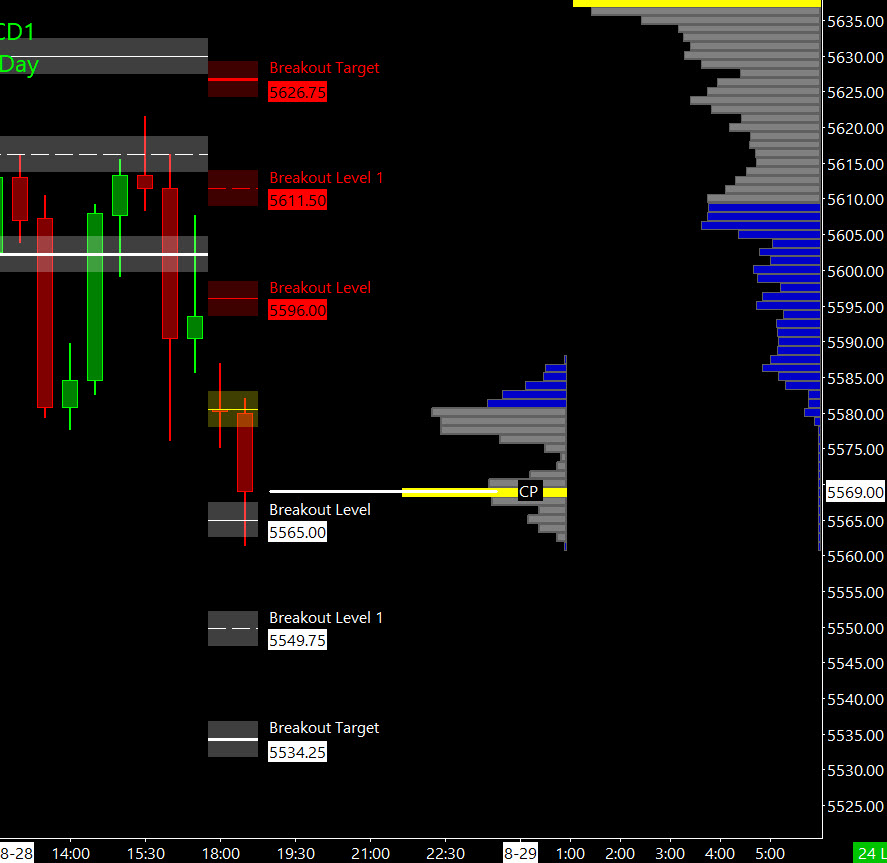
Nasdaq 100 (NQ)

Prior Session was Cycle Day 3: Three-Day Cycle Statistic (90%) was satisfied as price traded above the Cycle Day 1 Low (19505.50) during the RTH. Price also violated the Line in the Sand (LIS) 19650 which sparked a cascading selloff that drove price down to the August 14th breakout, completing a complex Head and Shoulders topping pattern. Nvidia (NVDA) earnings added plenty of adventurous trading post close. Range was 463 handles on 530k contracts exchanged.
…Transition from Cycle Day 3 to Cycle Day 1
This leads us into Cycle Day 1: Average Decline for CD1 (19354) has been exceeded during prior session’s sell-down. Price traded down to CD1 Violation Level (19163) as of this writing (7 pm), so we’ll be monitoring the NAZ closely for signs of potential reversals. Clear and Convert (CnC) back above P-VAL (19275) would be possible buy signal. As always, we’ll let Mr. Market be our “tour-guide.”
Our discipline of maintaining positioning that is aligned with market forces continues to serve us well, so stay the course.
As such, scenarios to consider for today’s trading.
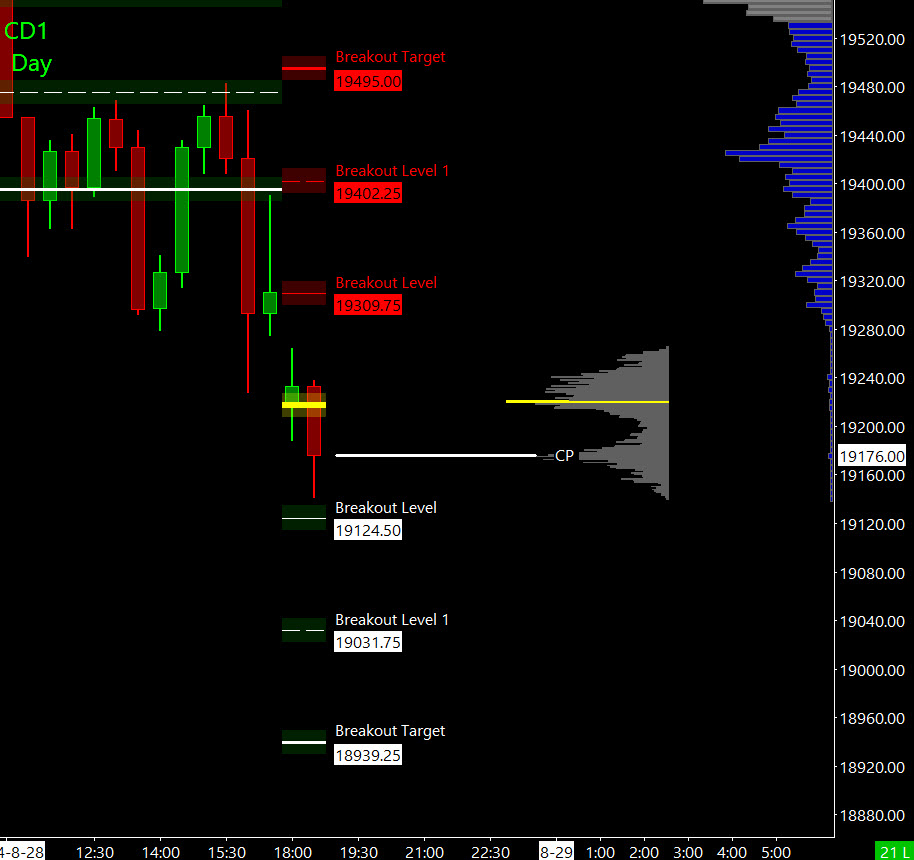
Bull Scenario: Price sustains a bid above 19275, initially targets 19402 – 19495 zone.
Bear Scenario: Price sustains an offer below 19275, initially targets 19163 – 19124 zone.
PVA High Edge = 19526 PVA Low Edge = 19273 Prior POC = 19421
NQ Chart
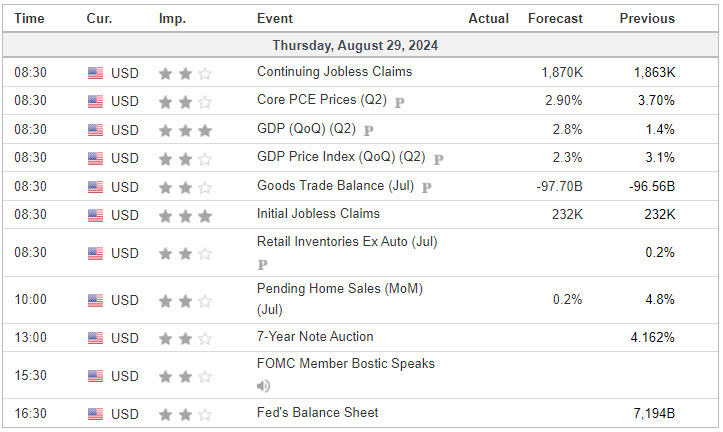
Economic Calendar
Trade Strategy: Our tactical trade strategy will simply remain unaltered…We’ll be flexible to trade both long and short side from Decision Pivot Levels. Continue to focus on Bull/Bear Stackers and Premium/Discounts. As always, remaining in alignment with dominant intra-day force increases probabilities of producing winning trades.
Stay Focused…Non-Biased…Disciplined ALWAYS USE STOPS!
Good Trading…David
“Knowing is not enough, We must APPLY. Willing is not enough, We must DO.” –BR
*****This trade strategy report is disseminated for “education only” and should not be viewed in any way as a recommendation to buy or sell futures products.”
PAST PERFORMANCE IS NOT NECESSARILY INDICATIVE OF FUTURE RESULTS
IMPORTANT NOTICE! No representation is being made that the use of this strategy or any system or trading methodology will generate profits. Past performance is not necessarily indicative of future results. There is substantial risk of loss associated with trading securities and options on equities. Only risk capital should be used to trade. Trading securities is not suitable for everyone.
Disclaimer: Futures, Options, and Currency trading all have large potential rewards, but they also have large potential risk. You must be aware of the risks and be willing to accept them in order to invest in these markets. Don’t trade with money you can’t afford to lose.
This website is neither a solicitation nor an offer to Buy/Sell futures, options, or currencies. No representation is being made that any account will or is likely to achieve profits or losses similar to those discussed on this web site. The past performance of any trading system or methodology is not necessarily indicative of future results.
CFTC RULE 4.41 –HYPOTHETICAL OR SIMULATED PERFORMANCE RESULTS HAVE CERTAIN LIMITATIONS. UNLIKE AN ACTUAL PERFORMANCE RECORD, SIMULATED RESULTS DO NOT REPRESENT ACTUAL TRADING. ALSO, SINCE THE TRADES HAVE NOT BEEN EXECUTED, THE RESULTS MAY HAVE UNDER-OR-OVER COMPENSATED FOR THE IMPACT, IF ANY, OF CERTAIN MARKET FACTORS, SUCH AS LACK OF LIQUIDITY. SIMULATED TRADING PROGRAMS IN GENERAL ARE ALSO SUBJECT TO THE FACT THAT THEY ARE DESIGNED WITH THE BENEFIT OF HINDSIGHT. NO REPRESENTATION IS BEING MADE THAT ANY ACCOUNT WILL OR IS LIKELY TO ACHIEVE PROFIT OR LOSSES SIMILAR TO THOSE SHOWN