
Markets (Top Stories)
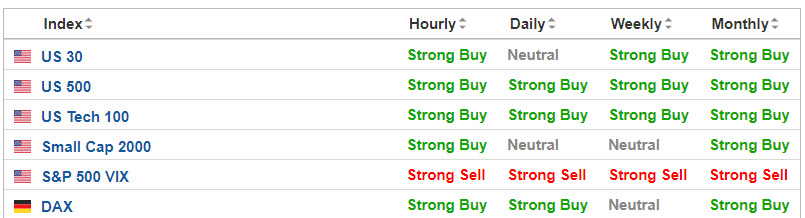
Source: SeekingAlpha.com
Economic Calendar
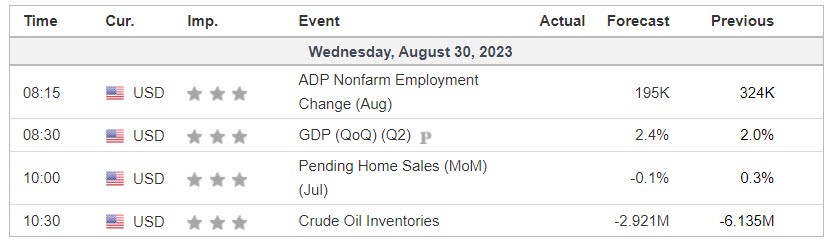
https://www.investing.com/economic-calendar/

S&P 500

***Written Tuesday evening for Wednesday’s trading for contribution to MrTopStep’s “The Opening Print” publication.
Prior Session was Cycle Day 3 (CD3): We’ll refer to today’s Cycle Day 3 action as “Jack-the-Ripper” as price “ripped” higher following the JOLTS report. Being the final trading day of the month, as T+2 settlement is Thursday and ahead of the long Labor Day Holiday, today was primed for a rally. Mr. Market just needed a spark to light that candle. Prior range was 76 handles on 1.374M contracts exchanged.
…Transition from Cycle Day 3 to Cycle Day 1
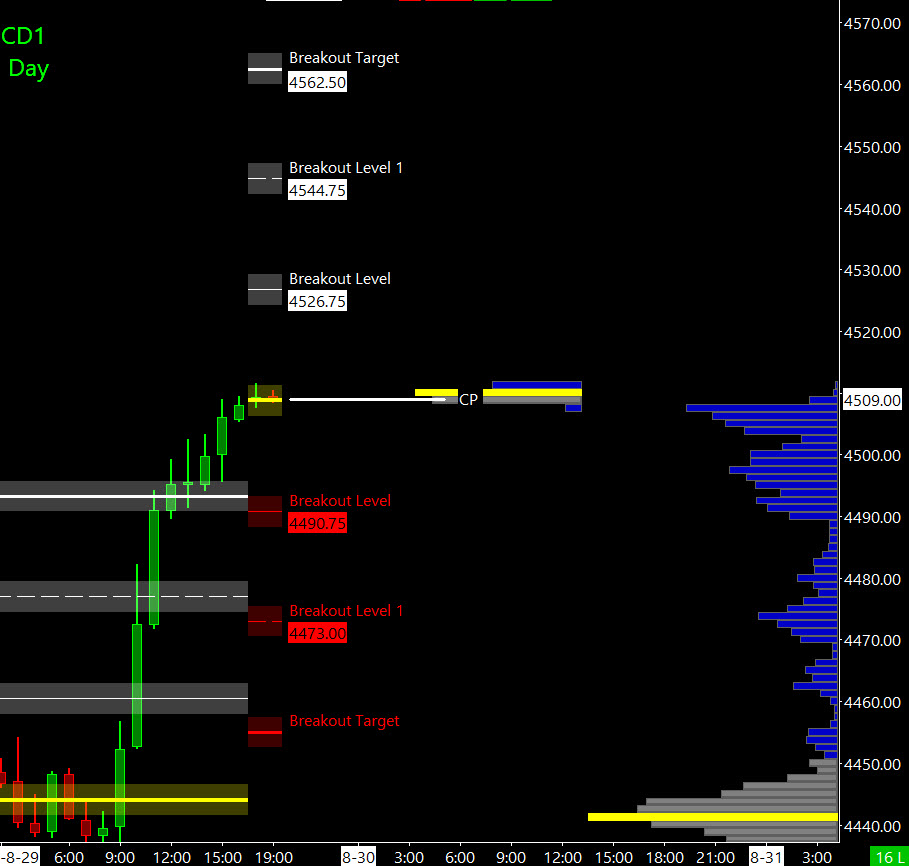
This leads us into Cycle Day 1 (CD1): Having closed near highs of the day, bullish momentum may take price higher before the next decline begins. The average decline for CD1 measures 4475 which we’ll mark as pullback support. Prior session’s CALL WALL was marked at 4509. We’ll see if this level caps price in today’s session. As such, scenarios to consider for today’s trading.
Bull Scenario: Price sustains a bid above 4510, initially targets 4520 – 4525 zone.
Bear Scenario: Price sustains an offer below 4510, initially targets 4495 – 4490 zone.
PVA High Edge = 4509 PVA Low Edge = 4473 Prior POC = 4507
*****The 3 Day Cycle has a 91% probability of fulfilling Positive Cycle Statistics covering 12 years of recorded tracking history.
For more detailed information for both bullish and bearish projected targets, please visit: PTG 3 Day Cycle and/or reference the Cycle Spreadsheet below:
Link to access full Cycle Spreadsheet > > Cycle Day 1 (CD1)
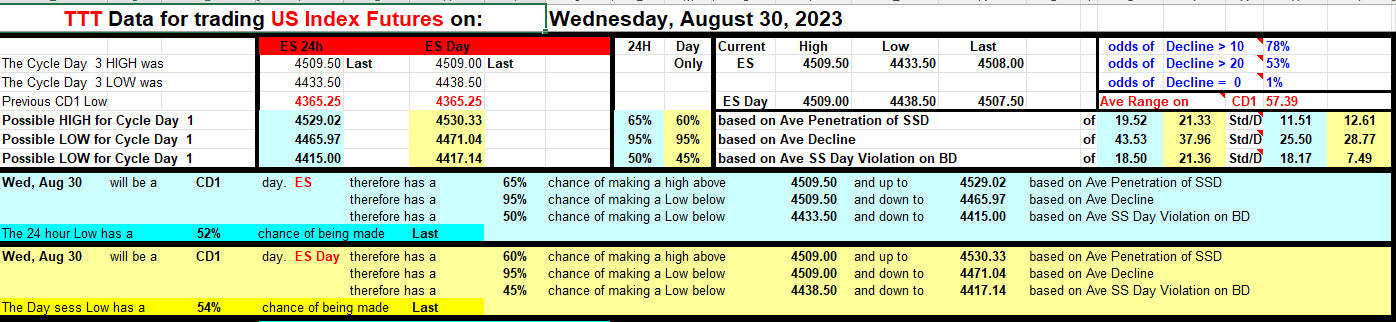
Range Projections and Key Levels (ES) Sept 2023 (U) Contract
HOD ATR Range Projection: 4568; LOD ATR Range Projection: 4450; 3 Day Central Pivot: 4440; 3 Day Cycle Target: 4563; 10 Day Average True Range 61; VIX: 14
Nasdaq 100 (NQ)

Prior Session was Cycle Day 3 (CD3): We’ll refer to today’s Cycle Day 3 action as “Jack-the-Ripper” as price “ripped” higher following the JOLTS report. Being the final trading day of the month, as T+2 settlement is Thursday and ahead of the long Labor Day Holiday, today was primed for a rally. Mr. Market just needed a spark to light that candle. Prior range was 380 handles on 604k contracts exchanged.
…Transition from Cycle Day 3 to Cycle Day 1
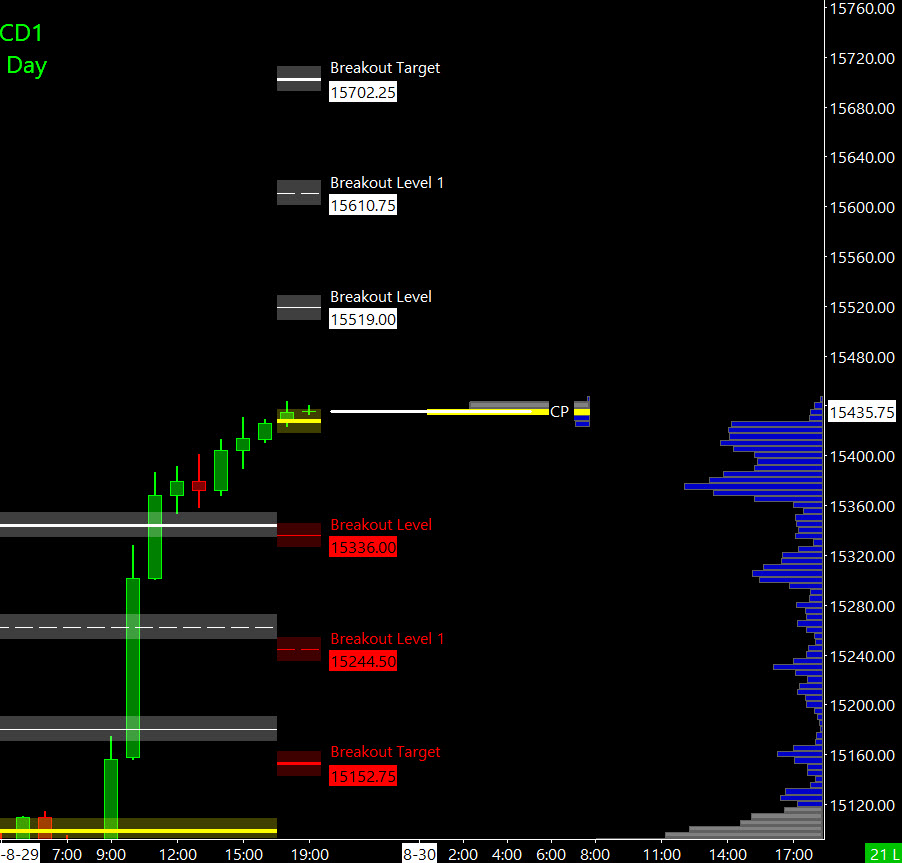
This leads us into Cycle Day 1 (CD1): Having closed near highs of the day, bullish momentum may take price higher before the next decline begins. The average decline for CD1 measures 15319. As such, scenarios to consider for today’s trading.
Bull Scenario: Price sustains a bid above 15430, initially targets 15470 – 15495 zone.
Bear Scenario: Price sustains an offer below 15430, initially targets 15375 – 15365 zone.
PVA High Edge = 15430 PVA Low Edge = 15218 Prior POC = 15374
Range Projections and Key Levels (NQ) Sept 2023 (U) Contract
HOD ATR Range Projection: 15725; LOD ATR Range Projection: 15140; 3 Day Central Pivot: 15097; 3 Day Cycle Target: 15730; 10 Day Average True Range: 302; VIX: 14
Trade Strategy: Our tactical trade strategy will simply remain unaltered…We’ll be flexible to trade both long and short side from Decision Pivot Levels. Continue to focus on Bull/Bear Stackers and Premium/Discounts. As always, remaining in alignment with dominant intra-day force increases probabilities of producing winning trades.
Stay Focused…Non-Biased…Disciplined ALWAYS USE STOPS!
Good Trading…David
“Knowing is not enough, We must APPLY. Willing is not enough, We must DO.” –Bruce Lee
*****This trade strategy report is disseminated for “education only” and should not be viewed in any way as a recommendation to buy or sell futures products.”
PAST PERFORMANCE IS NOT NECESSARILY INDICATIVE OF FUTURE RESULTS
IMPORTANT NOTICE! No representation is being made that the use of this strategy or any system or trading methodology will generate profits. Past performance is not necessarily indicative of future results. There is substantial risk of loss associated with trading securities and options on equities. Only risk capital should be used to trade. Trading securities is not suitable for everyone.
Disclaimer: Futures, Options, and Currency trading all have large potential rewards, but they also have large potential risk. You must be aware of the risks and be willing to accept them in order to invest in these markets. Don’t trade with money you can’t afford to lose.
This website is neither a solicitation nor an offer to Buy/Sell futures, options, or currencies. No representation is being made that any account will or is likely to achieve profits or losses similar to those discussed on this web site. The past performance of any trading system or methodology is not necessarily indicative of future results.
CFTC RULE 4.41 –HYPOTHETICAL OR SIMULATED PERFORMANCE RESULTS HAVE CERTAIN LIMITATIONS. UNLIKE AN ACTUAL PERFORMANCE RECORD, SIMULATED RESULTS DO NOT REPRESENT ACTUAL TRADING. ALSO, SINCE THE TRADES HAVE NOT BEEN EXECUTED, THE RESULTS MAY HAVE UNDER-OR-OVER COMPENSATED FOR THE IMPACT, IF ANY, OF CERTAIN MARKET FACTORS, SUCH AS LACK OF LIQUIDITY. SIMULATED TRADING PROGRAMS IN GENERAL ARE ALSO SUBJECT TO THE FACT THAT THEY ARE DESIGNED WITH THE BENEFIT OF HINDSIGHT. NO REPRESENTATION IS BEING MADE THAT ANY ACCOUNT WILL OR IS LIKELY TO ACHIEVE PROFIT OR LOSSES SIMILAR TO THOSE SHOWN