
S&P 500

Prior Session was Cycle Day 3: Three-Day Super Cycle as price rallied over 229 pts or 257.67% of the average cycle range of 89 pts. This cycle marks the seventh (7th) Super Cycle of the previous ten (10) cycle sequences. This demonstrates the outstanding dominance of the Taylor Three-Day Cycle.
…Transition from Cycle Day 3 to Cycle Day 1
This leads us into Cycle Day 1: Average Decline for CD1 measures (5667). BIG Event for this week is the FOMC Statement and Presser on Wednesday. Bulls maintain dominant control with little risk of losing it ahead of JPOW presser. Although there may be intra-day volatility swings to offer plenty of trade opportunities, so stay focused.
Our discipline of maintaining positioning that is aligned with market forces continues to serve us well, so stay the course.
As such, scenarios to consider for today’s trading.
Bull Scenario: Price sustains a bid above 5690, initially targets 5702 – 5712 zone.
Bear Scenario: Price sustains an offer below 5690, initially targets 5675 – 5670 zone.
PVA High Edge = 5699 PVA Low Edge = 5683 Prior POC = 5689
ES Chart (Profile)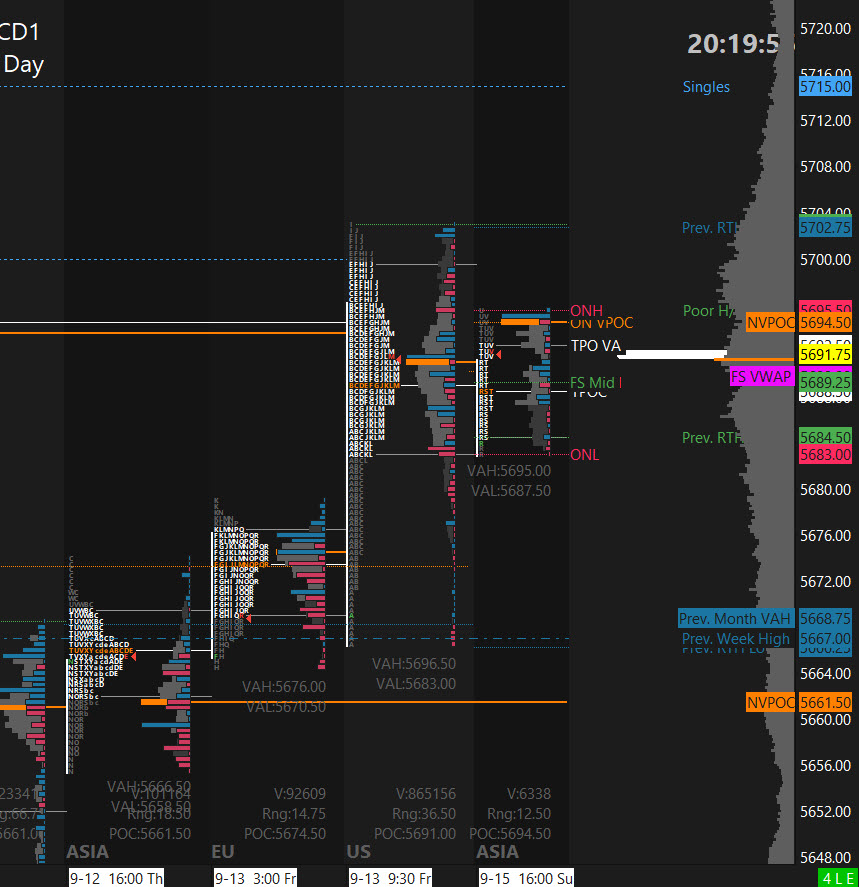
Nasdaq 100 (NQ)

Prior Session was Cycle Day 3: Three-Day Super Cycle as price rallied over 1200 pts. This cycle marks the seventh (7th) Super Cycle of the previous ten (10) cycle sequences. This demonstrates the outstanding dominance of the Taylor Three-Day Cycle.
…Transition from Cycle Day 3 to Cycle Day 1
This leads us into Cycle Day 1: Average Decline for CD1 measures (19455). BIG Event for this week is the FOMC Statement and Presser on Wednesday. Bulls maintain dominant control with little risk of losing it ahead of JPOW presser. Although there may be intra-day volatility swings to offer plenty of trade opportunities, so stay focused.
Our discipline of maintaining positioning that is aligned with market forces continues to serve us well, so stay the course.
As such, scenarios to consider for today’s trading.
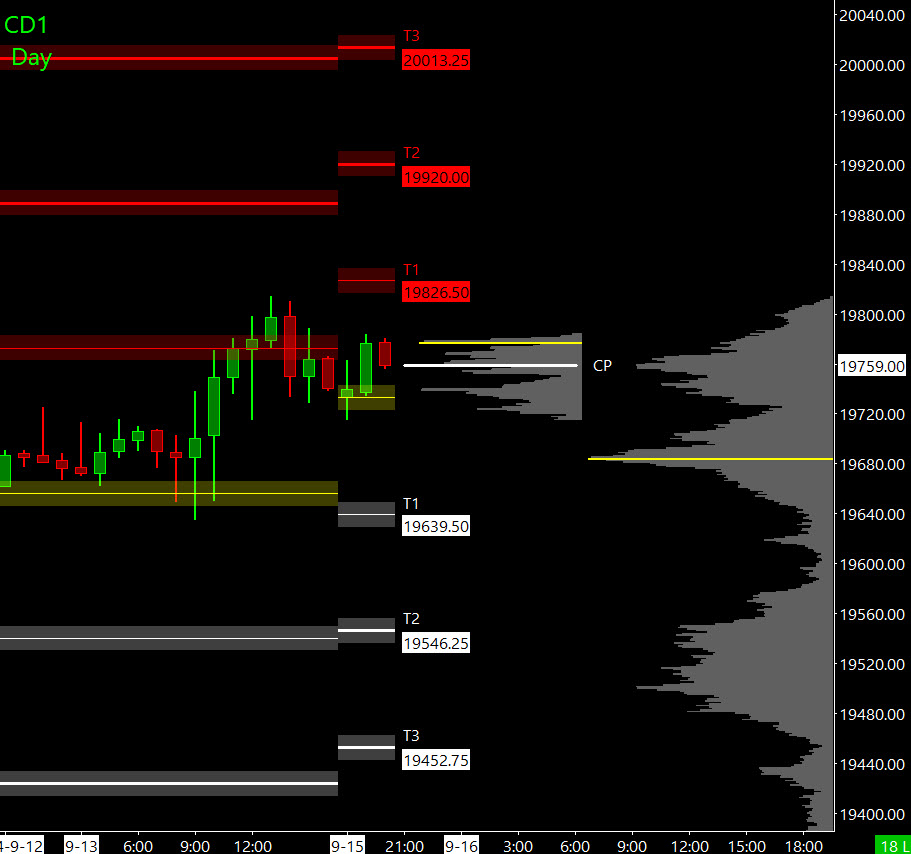
Bull Scenario: Price sustains a bid above 19740, initially targets 19820 – 19840 zone.
Bear Scenario: Price sustains an offer below 19740, initially targets 19685 – 19660 zone.
PVA High Edge = 197887 PVA Low Edge = 19721 Prior POC = 19747
NQ Chart (Target Master)
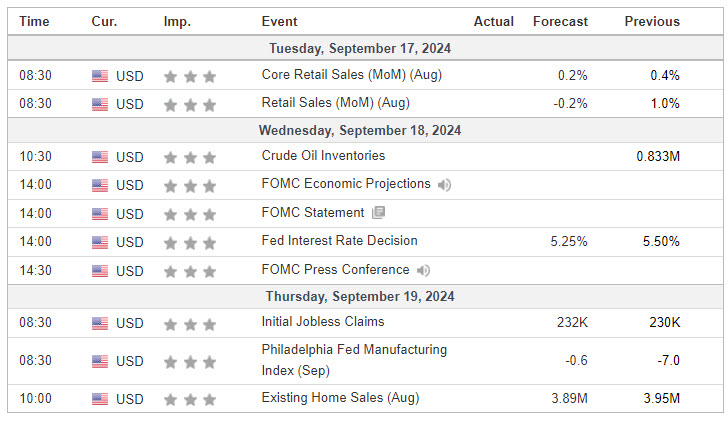
Economic Calendar
Trade Strategy: Our tactical trade strategy will simply remain unaltered…We’ll be flexible to trade both long and short side from Decision Pivot Levels. Continue to focus on Bull/Bear Stackers and Premium/Discounts. As always, remaining in alignment with dominant intra-day force increases probabilities of producing winning trades.
Stay Focused…Non-Biased…Disciplined ALWAYS USE STOPS!
Good Trading…David
“Knowing is not enough, We must APPLY. Willing is not enough, We must DO.” –BR
*****This trade strategy report is disseminated for “education only” and should not be viewed in any way as a recommendation to buy or sell futures products.”
PAST PERFORMANCE IS NOT NECESSARILY INDICATIVE OF FUTURE RESULTS
IMPORTANT NOTICE! No representation is being made that the use of this strategy or any system or trading methodology will generate profits. Past performance is not necessarily indicative of future results. There is substantial risk of loss associated with trading securities and options on equities. Only risk capital should be used to trade. Trading securities is not suitable for everyone.
Disclaimer: Futures, Options, and Currency trading all have large potential rewards, but they also have large potential risk. You must be aware of the risks and be willing to accept them in order to invest in these markets. Don’t trade with money you can’t afford to lose.
This website is neither a solicitation nor an offer to Buy/Sell futures, options, or currencies. No representation is being made that any account will or is likely to achieve profits or losses similar to those discussed on this web site. The past performance of any trading system or methodology is not necessarily indicative of future results.
CFTC RULE 4.41 –HYPOTHETICAL OR SIMULATED PERFORMANCE RESULTS HAVE CERTAIN LIMITATIONS. UNLIKE AN ACTUAL PERFORMANCE RECORD, SIMULATED RESULTS DO NOT REPRESENT ACTUAL TRADING. ALSO, SINCE THE TRADES HAVE NOT BEEN EXECUTED, THE RESULTS MAY HAVE UNDER-OR-OVER COMPENSATED FOR THE IMPACT, IF ANY, OF CERTAIN MARKET FACTORS, SUCH AS LACK OF LIQUIDITY. SIMULATED TRADING PROGRAMS IN GENERAL ARE ALSO SUBJECT TO THE FACT THAT THEY ARE DESIGNED WITH THE BENEFIT OF HINDSIGHT. NO REPRESENTATION IS BEING MADE THAT ANY ACCOUNT WILL OR IS LIKELY TO ACHIEVE PROFIT OR LOSSES SIMILAR TO THOSE SHOWN