
S&P 500

Trade Plan for FOMC Day
Market Context:
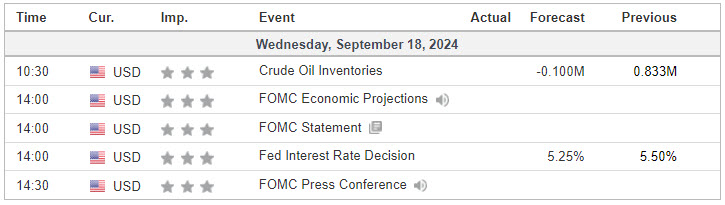
- Event: Federal Open Market Committee (FOMC) statement, followed by a press conference by the Federal Reserve Chair (JPOW).
- Timing: The FOMC statement is released at 2:00 PM ET, and the press conference starts at 2:30 PM ET.
- Pre-FOMC: Markets usually trade cautiously and in a narrow range leading up to the announcement.
- Post-FOMC: The announcement and press conference introduce significant volatility. Markets tend to see sharp moves, whipsaws, and reversals as traders react to the statement and JPOW’s commentary.
Key FOMC Day Strategy Considerations:
- Volatility Spike: Expect a significant increase in volatility post-announcement. Be prepared for sharp price swings, fake breakouts, and potential liquidity traps.
- Patience: The best strategy is often to stay on the sidelines until after the initial volatility spike (post-2:30 PM) unless you’re highly experienced in trading fast-moving markets.
- Price Action Guidance: Focus on key levels that are being tested and respected before and after the announcement.
Key Levels for FOMC Day:
- Pre-FOMC Range:
- Often, a range forms during the pre-FOMC session. The high and low of this range become important levels for post-announcement trades.
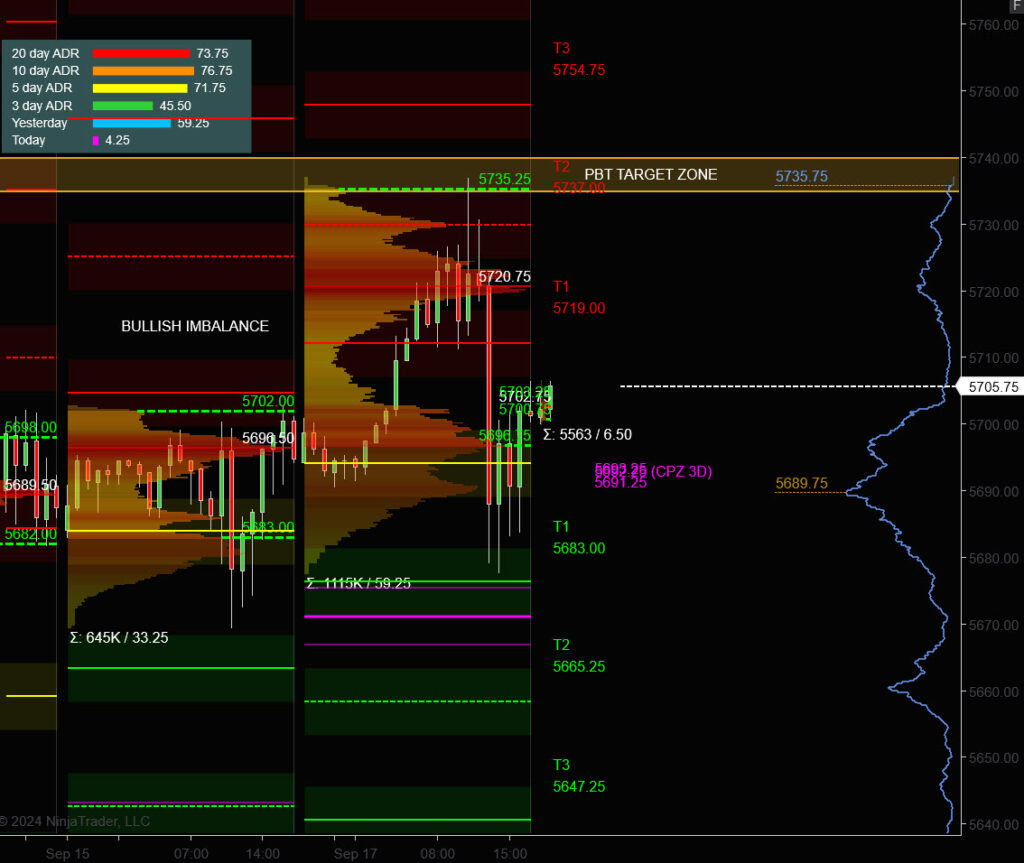
- Pre-FOMC Resistance: The upper boundary of the range, potentially near 5735 (or wherever resistance forms).
- Pre-FOMC Support: The lower boundary, possibly around 5696 or another key pivot.
- FOMC-Driven Targets:
- Upside Targets:
- 5735 (PVA High Edge) and 5750 (cycle extension if buyers dominate).
- Above 5750, 5770–5780 is a potential zone if there’s a significant breakout.
- Downside Targets:
- 5696 (PVA Low Edge) and 5670 (support zone).
- Below 5670, 5650–5635 could be a stretch target on heavy selling.
- Upside Targets:
Pre-FOMC Strategy (Before 2:00 PM):
- Neutral Bias:
- The market tends to trade cautiously before the FOMC, and liquidity can dry up.
- Avoid large directional bets and trade within the pre-FOMC range.
- Scalping Inside the Range:
- Trade the pre-FOMC range with tight stops and small position sizing.
- Look for price to respect resistance near 5735 and support near 5696 for potential mean-reversion trades.
- Reduce Size: If you’re trading pre-FOMC, reduce your position size due to the potential for sudden movements.
Post-FOMC Strategy (After 2:00 PM):
Primary Strategy: Trade the Reaction, Not the Event
- Avoid Initial Spike (2:00 – 2:30 PM):
- The first few minutes after the announcement can be extremely volatile with wide price swings, false breakouts, and reversals. It’s often best to stay out and observe.
- Identify Clear Direction (After 2:30 PM):
- Once JPOW’s press conference begins, the market typically chooses a more sustained direction based on the Fed’s tone, economic outlook, or any surprises in the rate decision.
- Bullish Scenario:
- If price breaks above the pre-FOMC range and holds above key levels (e.g., 5735), look for long opportunities targeting the next resistance levels (5750, 5770).
- Entry: After a clear break and retest of 5735 or other key pivot levels.
- Bearish Scenario:
- If price breaks below the pre-FOMC range and holds under 5696, short opportunities targeting 5670, then potentially 5650.
- Entry: On a confirmed break and hold below 5696 or a key lower pivot after volatility subsides.
- Watch for Reversals:
- Often, the market may spike in one direction after the FOMC release and then reverse as traders digest the full implications. Be ready for potential V-shaped reversals after the initial move.
- Plan: If the market shows a strong fake-out (e.g., breaks higher but immediately retraces back into the range), look for opportunities to trade in the opposite direction with tight stops.
- Time-Based Consideration:
- The most reliable moves often happen after the press conference, from 2:45 PM – 3:30 PM ET. This is when the market digests all the information and typically trends more smoothly.
- Final Hour of Trading: The last hour of trading (3:00 PM – 4:00 PM) can see sharp continuation moves or violent reversals, depending on the market’s interpretation of the FOMC outcome.
Risk Management:
- Position Sizing: Given the increased volatility, reduce position sizes to manage risk.
- Stop Losses: Use wider stops than usual due to expected price spikes but avoid over-leveraging. Adjust your stop loss as the market picks a direction.
- Risk-Reward: Look for setups with at least a 2:1 reward-to-risk ratio, given the potential for large moves.
- Volatility Management: If the market becomes too erratic, it may be better to stand aside rather than chase the action.
PVA High Edge = 5735 PVA Low Edge = 5696 Prior POC = 5720
ES Chart
Nasdaq 100 (NQ)

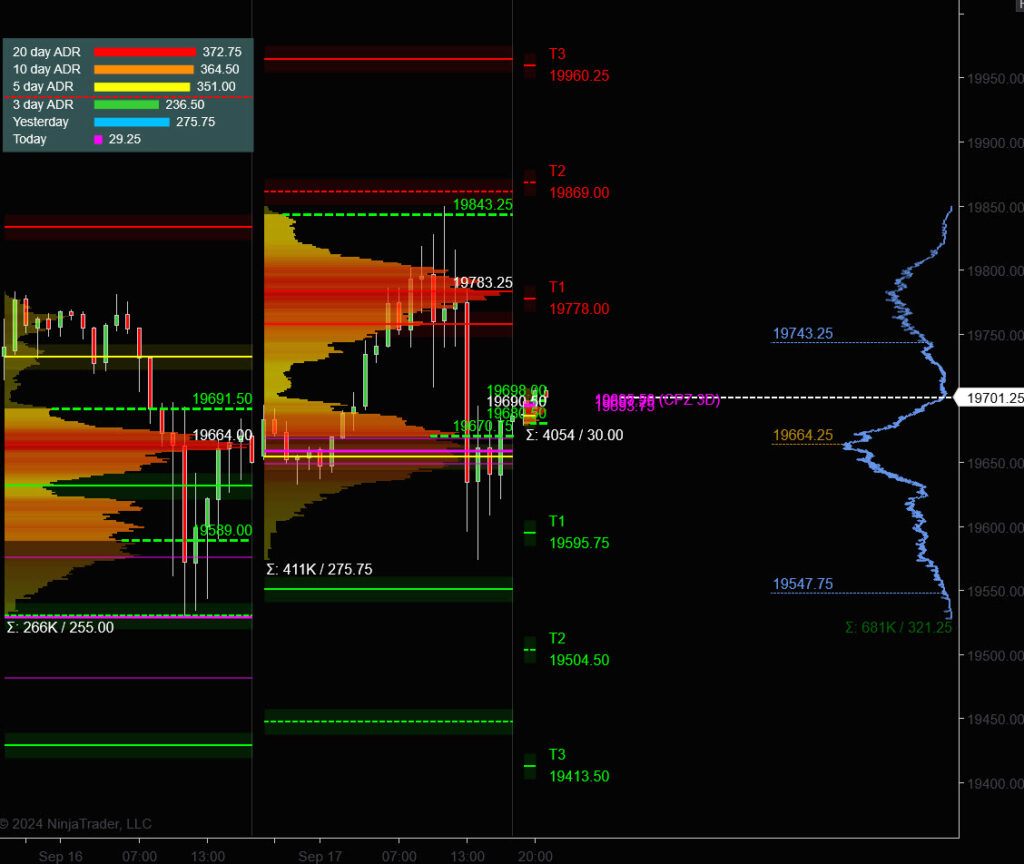
Prior Session was Cycle Day 2: True Opening Gap higher extended this rally to satisfy the 19754 – 19785 target zone as outlined in the DTS Briefing 9.17.24. It did not take long for aggressive sellers to use the early strength as an opportunity to liquidate longs and add to short positions.
Gap fill came during the lunch time with a break of the Opening Range driving price down to 19590 which again was the DTS Briefing target. Perfect “Level -2- Level” range edges. The remainder of the afternoon session saw rotation around the 3 Day Central Pivot (19650). Range was 275 handles on 411k contracts exchanged.
…Transition from Cycle Day 2 to Cycle Day 3
This leads us into Cycle Day 3: Primary Cycle Target (19680) has been fulfilled, with higher levels still open. BIG Event for today is the FOMC Statement and Presser at 2:30 pm. Expectation is for 25 bps cut with an outside chance for 50bps.
Be prepared for heightened volatility as trader bets are wide and varied. JPOW Presser comments will be closely parsed, adding to potential volatile price swings. Best action for today is to keep positioning “close-to-the-vest” and do not be a cowboy! Prudent $risk management is essential, particularly on these highly volatile day types.
Our discipline of maintaining positioning that is aligned with market forces continues to serve us well, so stay the course.
As such, scenarios to consider for today’s trading.
Bull Scenario: Price sustains a bid above 19695, initially targets 19816 – 19890 zone.
Bear Scenario: Price sustains an offer below 19695, initially targets 19596 – 19548 zone.
PVA High Edge = 19843 PVA Low Edge = 19670 Prior POC = 19783
NQ Chart
Economic Calendar
Trade Strategy: Our tactical trade strategy will simply remain unaltered…We’ll be flexible to trade both long and short side from Decision Pivot Levels. Continue to focus on Bull/Bear Stackers and Premium/Discounts. As always, remaining in alignment with dominant intra-day force increases probabilities of producing winning trades.
Stay Focused…Non-Biased…Disciplined ALWAYS USE STOPS!
Good Trading…David
“Knowing is not enough, We must APPLY. Willing is not enough, We must DO.” –BR
*****This trade strategy report is disseminated for “education only” and should not be viewed in any way as a recommendation to buy or sell futures products.”
PAST PERFORMANCE IS NOT NECESSARILY INDICATIVE OF FUTURE RESULTS
IMPORTANT NOTICE! No representation is being made that the use of this strategy or any system or trading methodology will generate profits. Past performance is not necessarily indicative of future results. There is substantial risk of loss associated with trading securities and options on equities. Only risk capital should be used to trade. Trading securities is not suitable for everyone.
Disclaimer: Futures, Options, and Currency trading all have large potential rewards, but they also have large potential risk. You must be aware of the risks and be willing to accept them in order to invest in these markets. Don’t trade with money you can’t afford to lose.
This website is neither a solicitation nor an offer to Buy/Sell futures, options, or currencies. No representation is being made that any account will or is likely to achieve profits or losses similar to those discussed on this web site. The past performance of any trading system or methodology is not necessarily indicative of future results.
CFTC RULE 4.41 –HYPOTHETICAL OR SIMULATED PERFORMANCE RESULTS HAVE CERTAIN LIMITATIONS. UNLIKE AN ACTUAL PERFORMANCE RECORD, SIMULATED RESULTS DO NOT REPRESENT ACTUAL TRADING. ALSO, SINCE THE TRADES HAVE NOT BEEN EXECUTED, THE RESULTS MAY HAVE UNDER-OR-OVER COMPENSATED FOR THE IMPACT, IF ANY, OF CERTAIN MARKET FACTORS, SUCH AS LACK OF LIQUIDITY. SIMULATED TRADING PROGRAMS IN GENERAL ARE ALSO SUBJECT TO THE FACT THAT THEY ARE DESIGNED WITH THE BENEFIT OF HINDSIGHT. NO REPRESENTATION IS BEING MADE THAT ANY ACCOUNT WILL OR IS LIKELY TO ACHIEVE PROFIT OR LOSSES SIMILAR TO THOSE SHOWN