
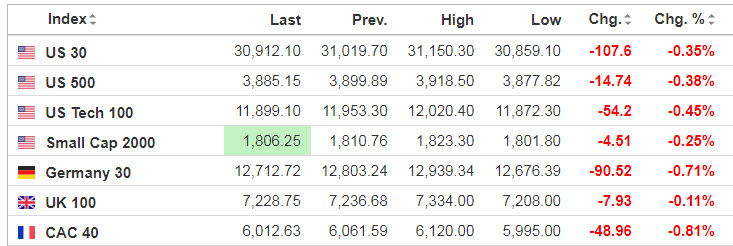
Markets
The 10-year Treasury yield crossed 3.5% on Monday for the first time since 2011, while the rate on the 2-year Treasury rose overnight to a 15-year high of 3.97%. The deep inversion and bearish run in the bond market is spooking investors ahead of another monster rate hike by the Fed, which meets today for its September meeting. As long as inflation continues to surprise to the upside, the volatility will likely remain, with the central bank now clearly willing to bring down the price pressures at all costs.
Source: SeekingAlpha.com
Economic Calendar
FOMC meeting begins
8:30 Housing Starts and Permits
1:00 PM Results of $12B, 20-Year Bond Auction
https://www.investing.com/economic-calendar/
***New: PTG Trading Room Chat Log’s Link
S&P 500

Prior Session was Cycle Day 3 (CD3): Gap lower found support at the critical 3850 level, at which time price reversed and proceeded to rally throughout the session, recovering the CD1 Low for a Positive 3 Day Cycle. Prior range was 81 handles on 2.046M contracts exchanged.
…Transition from Cycle Day 3 to Cycle Day 1
This leads us into Cycle Day 1 (CD1): Average Decline for CD1 measures 3855, which continues to be critical support. Key event is FED Day tomorrow, so as such traders will be positioning for continued volatility. As such, estimated scenarios to consider for today’s trading.
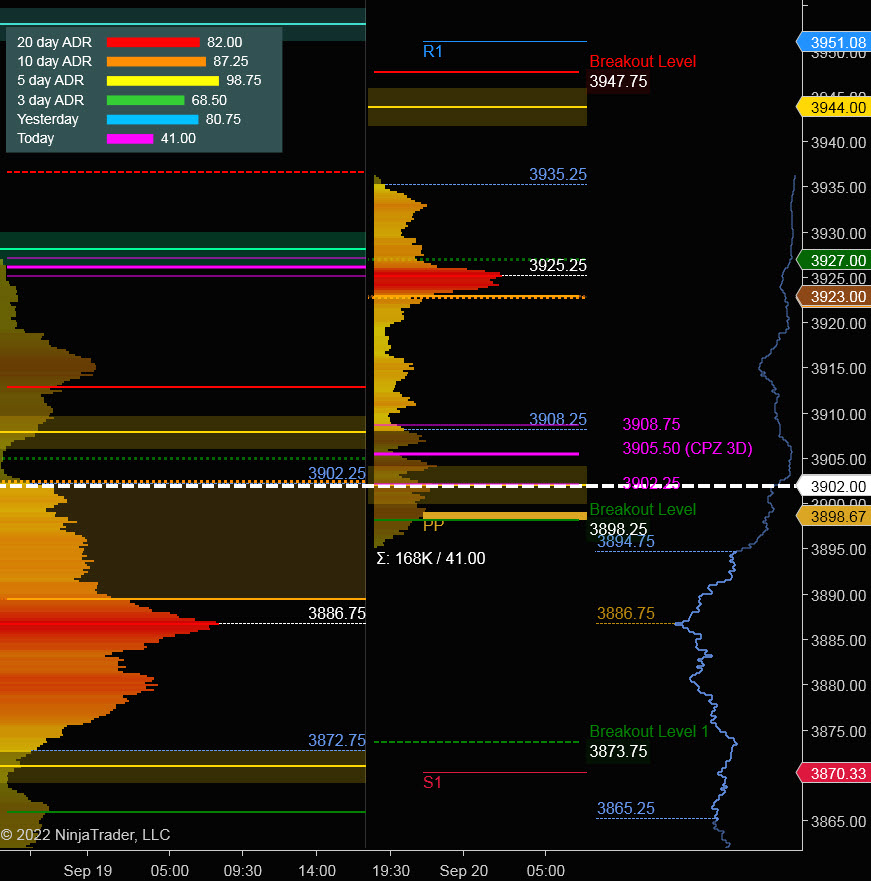
Bull Scenario: Price sustains a bid above 3905, initially targets 3925 – 3930 zone.
Bear Scenario: Price sustains an offer below 3905, initially targets 3885 – 3880 zone.
PVA High Edge = 3902 PVA Low Edge = 3873 Prior POC = 3887
Range Projections and Key Levels (ES) December 2022 (Z) Contract
HOD ATR Range Projection: 3982; LOD ATR Range Projection: 3848; 3 Day Central Pivot: 3905; 3 Day Cycle Target: 3983; 10 Day Average True Range 87; VIX: 26
Nasdaq 100 (NQ)

Today is Cycle Day 1 (CD1)…Average Decline for CD1 measures 11768. Prior range was 274 handles on 740k contracts ts exchanged. As such, there are two estimated scenarios to consider for today’s trading.
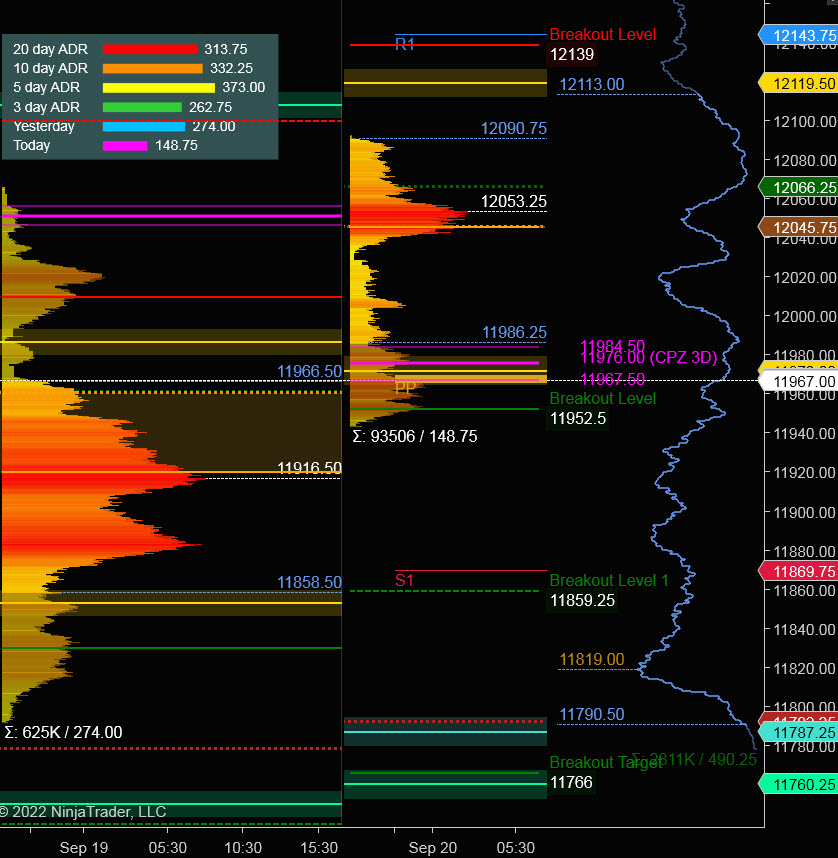
Bull Scenario: IF Bulls sustains bid above 11970, THEN initial upside estimate targets 12025– 12050 zone.
Bear Scenario: IF Bears sustains offer below 11970, THEN initial downside estimate targets 11950 – 11920 zone.
PVA High Edge = 11966 PVA Low Edge = 11858 Prior POC = 11916
Range Projections and Key Levels (NQ) December 2022 (Z) Contract
HOD ATR Range Projection: 12280; LOD ATR Range Projection: 11755; 3 Day Central Pivot: 11976; 3 Day Cycle Target: 12480; 10 Day Average True Range: 336; VIX: 26
Trade Strategy: Our tactical trade strategy will simply remain unaltered…We’ll be flexible to trade both long and short side from Decision Pivot Levels. Continue to focus on Bull/Bear Stackers and Premium/Discounts. As always, remaining in alignment with dominant intra-day force increases probabilities of producing winning trades.
Stay Focused…Non-Biased…Disciplined ALWAYS USE STOPS!
Good Trading…David
“Knowing is not enough, We must APPLY. Willing is not enough, We must DO.” –Bruce Lee
*****This trade strategy report is disseminated for “education only” and should not be viewed in any way as a recommendation to buy or sell futures products.”
PAST PERFORMANCE IS NOT NECESSARILY INDICATIVE OF FUTURE RESULTS
IMPORTANT NOTICE! No representation is being made that the use of this strategy or any system or trading methodology will generate profits. Past performance is not necessarily indicative of future results. There is substantial risk of loss associated with trading securities and options on equities. Only risk capital should be used to trade. Trading securities is not suitable for everyone.
Disclaimer: Futures, Options, and Currency trading all have large potential rewards, but they also have large potential risk. You must be aware of the risks and be willing to accept them in order to invest in these markets. Don’t trade with money you can’t afford to lose.
This website is neither a solicitation nor an offer to Buy/Sell futures, options, or currencies. No representation is being made that any account will or is likely to achieve profits or losses similar to those discussed on this web site. The past performance of any trading system or methodology is not necessarily indicative of future results.
CFTC RULE 4.41 –HYPOTHETICAL OR SIMULATED PERFORMANCE RESULTS HAVE CERTAIN LIMITATIONS. UNLIKE AN ACTUAL PERFORMANCE RECORD, SIMULATED RESULTS DO NOT REPRESENT ACTUAL TRADING. ALSO, SINCE THE TRADES HAVE NOT BEEN EXECUTED, THE RESULTS MAY HAVE UNDER-OR-OVER COMPENSATED FOR THE IMPACT, IF ANY, OF CERTAIN MARKET FACTORS, SUCH AS LACK OF LIQUIDITY. SIMULATED TRADING PROGRAMS IN GENERAL ARE ALSO SUBJECT TO THE FACT THAT THEY ARE DESIGNED WITH THE BENEFIT OF HINDSIGHT. NO REPRESENTATION IS BEING MADE THAT ANY ACCOUNT WILL OR IS LIKELY TO ACHIEVE PROFIT OR LOSSES SIMILAR TO THOSE SHOWN