
Markets

Economic Calendar
8:30 Chicago Fed National Activity Index
10:30 Dallas Fed Manufacturing Survey
12:00 PM Fed’s Bostic Speech
4:00 PM Fed’s Mester Speech
https://www.investing.com/economic-calendar/
***New: PTG Trading Room Chat Log’s Link
S&P 500

Prior Session was Cycle Day 1 (CD1): Normal CD1 unfolded as price traded with a heavy sell bias, ending a volatile week with new CD1 Low @ 3660.25. Range was 123 handles, on 2.805M contracts exchanged.
…Transition from Cycle Day 1 to Cycle Day 2
This leads us into Cycle Day 2 (CD2): Price is holding above CD1 Low (3660.25) during overnight activity. Market is in need of a neutral day to stabilize recent persistent selling. As we know, for CD2 expectation is for back n fill / consolidation, though in this case with a downward lean as “risk-off” remains the dominant theme. As such, estimated scenarios to consider for today’s trading.
Bull Scenario: Price sustains a bid above 3690, initially targets 3710 – 3715 zone.
Bear Scenario: Price sustains an offer below 3690, initially targets 3670 – 3660 zone.
*****3 Day Cycle has a 91% probability of fulfilling Positive Cycle Statistics covering 12 years of recorded tracking history.
PVA High Edge = 3714 PVA Low Edge = 3676 Prior POC = 3707
Range Projections and Key Levels (ES) December 2022 (Z) Contract
HOD ATR Range Projection: 3768; LOD ATR Range Projection: 3621; 3 Day Central Pivot: 3780; 3 Day Cycle Target: 3705; 10 Day Average True Range; 97; VIX: 32

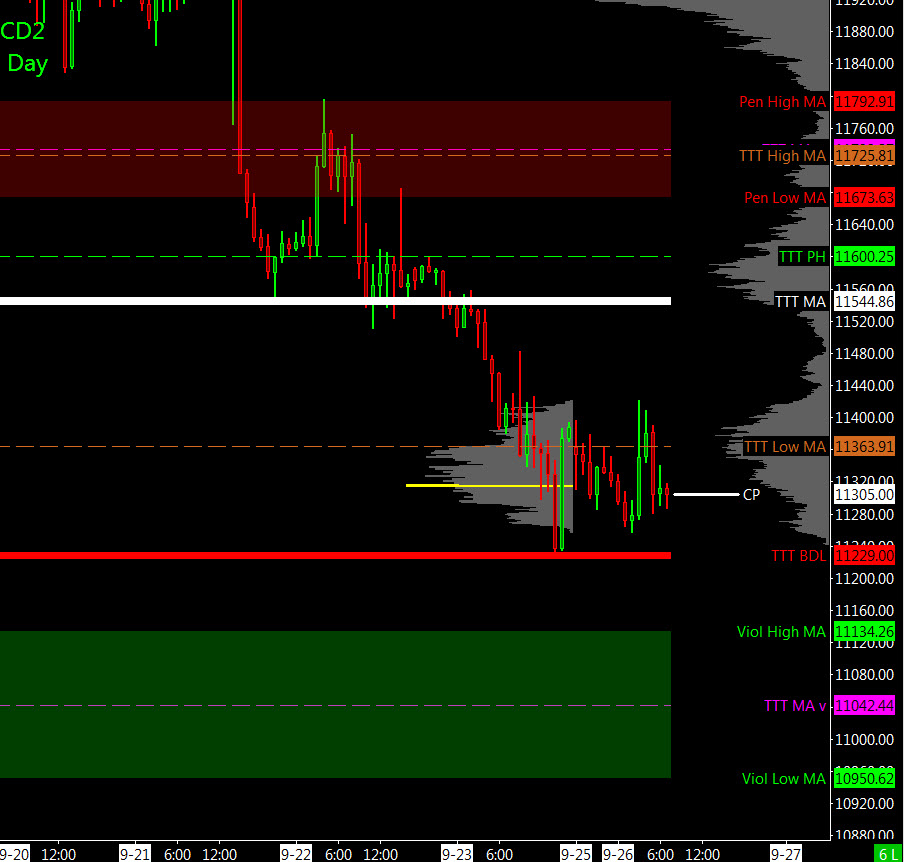
Nasdaq 100 (NQ)

Today is Cycle Day 2 (CD2)…Normal for CD2 is for some back n fill / stabilization following last week’s risk-off selling spree. Prior range was 371 handles on 793k contracts exchanged. As such, there are two estimated scenarios to consider for today’s trading.
Bull Scenario: IF Bulls sustain a bid above 11330, THEN initial upside estimate targets 11400 – 11420 zone.
Bear Scenario: IF Bears sustain an offer below 11330 THEN initial downside estimate targets 11260– 11230 zone.
PVA High Edge = 11422 PVA Low Edge = 11302 Prior POC = 11365
Range Projections and Key Levels (NQ) December 2022 (Z) Contract
HOD ATR Range Projection: 11610; LOD ATR Range Projection: 11068; 3 Day Central Pivot: 11620; 3 Day Cycle Target: 11544; 10 Day Average True Range: 353; VIX: 32
Trade Strategy: Our tactical trade strategy will simply remain unaltered…We’ll be flexible to trade both long and short side from Decision Pivot Levels. Continue to focus on Bull/Bear Stackers and Premium/Discounts. As always, remaining in alignment with dominant intra-day force increases probabilities of producing winning trades.
Stay Focused…Non-Biased…Disciplined ALWAYS USE STOPS!
Good Trading…David
“Knowing is not enough, We must APPLY. Willing is not enough, We must DO.” –Bruce Lee
*****This trade strategy report is disseminated for “education only” and should not be viewed in any way as a recommendation to buy or sell futures products.”
PAST PERFORMANCE IS NOT NECESSARILY INDICATIVE OF FUTURE RESULTS
IMPORTANT NOTICE! No representation is being made that the use of this strategy or any system or trading methodology will generate profits. Past performance is not necessarily indicative of future results. There is substantial risk of loss associated with trading securities and options on equities. Only risk capital should be used to trade. Trading securities is not suitable for everyone.
Disclaimer: Futures, Options, and Currency trading all have large potential rewards, but they also have large potential risk. You must be aware of the risks and be willing to accept them in order to invest in these markets. Don’t trade with money you can’t afford to lose.
This website is neither a solicitation nor an offer to Buy/Sell futures, options, or currencies. No representation is being made that any account will or is likely to achieve profits or losses similar to those discussed on this web site. The past performance of any trading system or methodology is not necessarily indicative of future results.
CFTC RULE 4.41 –HYPOTHETICAL OR SIMULATED PERFORMANCE RESULTS HAVE CERTAIN LIMITATIONS. UNLIKE AN ACTUAL PERFORMANCE RECORD, SIMULATED RESULTS DO NOT REPRESENT ACTUAL TRADING. ALSO, SINCE THE TRADES HAVE NOT BEEN EXECUTED, THE RESULTS MAY HAVE UNDER-OR-OVER COMPENSATED FOR THE IMPACT, IF ANY, OF CERTAIN MARKET FACTORS, SUCH AS LACK OF LIQUIDITY. SIMULATED TRADING PROGRAMS IN GENERAL ARE ALSO SUBJECT TO THE FACT THAT THEY ARE DESIGNED WITH THE BENEFIT OF HINDSIGHT. NO REPRESENTATION IS BEING MADE THAT ANY ACCOUNT WILL OR IS LIKELY TO ACHIEVE PROFIT OR LOSSES SIMILAR TO THOSE SHOWN