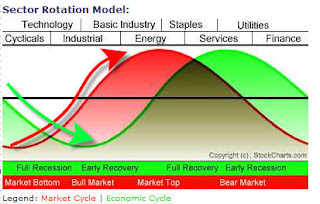
 The chart above depicts the graphical relationship of the Economic and Stock Market Cycles based upon Sam Stovall’s theoretical model of Sector Rotation. It’s generally accepted the stock market leads the economy by 6 – 9 months. In other words, it “discounts” future economic activity. More specifically, certain sectors tend to be outperformers on a relative basis while others are laggards. The Sector Rotation Model gives investors a template upon which to identify what point in the “cycle” the economy and stock market are and which sectors are most likely to attract investor funds.
The green arrow represents the economy and red arrow the stock market. The sectors that comprise the SP500 are overlapped above in a very specific order. Currently the economy is considered to be in FULL RECESSION and MARKET BOTTOM (potentially). If that assumption holds true, then the Sectors that should see relative strength at this point in the cycle are TECHNOLOGY, FINANCIALS, CYCLICALS and BASIC MATERIALS. The laggards should be CONSUMER STAPLES, UTILITIES, HEALTHCARE and ENERGY.
If you examine the previous posting labeled Sector Performance you will notice that those specific Sectors that are modeled to be outperformers at this point in the cycle are indeed leaders as the Market is attempting a bottoming process.
It is important for the trader to keep close watch on the performance of these various sectors going forward as they will in effect give us the “temperature” of the markets and the economy’s future.
