
Markets
In Asia, Japan -2%. Hong Kong +0.3%. China closed. India -0.5%.
In Europe, at midday, London -0.5%. Paris +0.6%. Frankfurt closed.
Futures at 6:20, Dow +0.3%. S&P +0.4%. Nasdaq +0.5%. Crude -0.4% to $52.42. Gold flat at $1507.70. Bitcoin +0.4% to $8281.
Ten-year Treasury Yield -2 bps to 1.58%
(Source: Seeking Alpha) https://seekingalpha.com/
Economic Calendar
8:30Initial Jobless Claims
8:30Fed’s Quarles: “The Financial Stability Board at 10 Years”
9:45PMI Services Index
10:00ISM Non-Manufacturing Index
10:00Factory Orders
10:30EIA Natural Gas Inventory
12:10 PMFed’s Mester Speech
4:30 PMMoney Supply
4:30 PMFed Balance Sheet
https://www.investing.com/economic-calendar/
*****New PTG Trading Room Chat Log’s Link
S&P 500
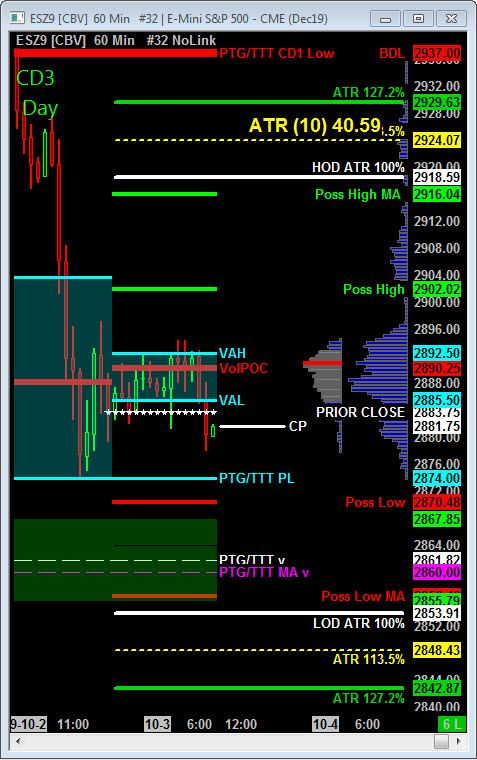
Today is Cycle Day 3 …Continued fallout from the missed ISM Report pushed price lower to 200% of 10-day Average True Range which is a rare occurrence in prior session. Buyers responded aggressively and price rebound back to VWAP by session close where it is currently trading in overnight action. Bulls need a conversion above 2895 – 2900 zone. Bears are expected to defend to keep a lid. Further downside potential measures 2860 – 2850 zone for this Cycle.
CD3 Range High = 2905.00 CD3 Range Low = 2856.00 CD3 Range Avg = 38.00
Scenario 1: IF Bulls hold bid above 2883, THEN initial upside targets 2893 – 2900 zone.
Scenario 2: IF Bears hold offer below 2883, THEN initial downside targets 2875 – 2870 zone.
Range Projections and Key Levels (ES) December (Z) Contract
HOD ATR Range Projection: 2922.00; LOD ATR Range Projection: 2854.00; Cycle Day 1 Low: 2937.00; 3 Day Central Pivot: 2946.00; 3 Day Cycle Target: 2965.00; 10 Day Average True Range 40.59; VIX: 20.28
Nasdaq 100 (NQ)
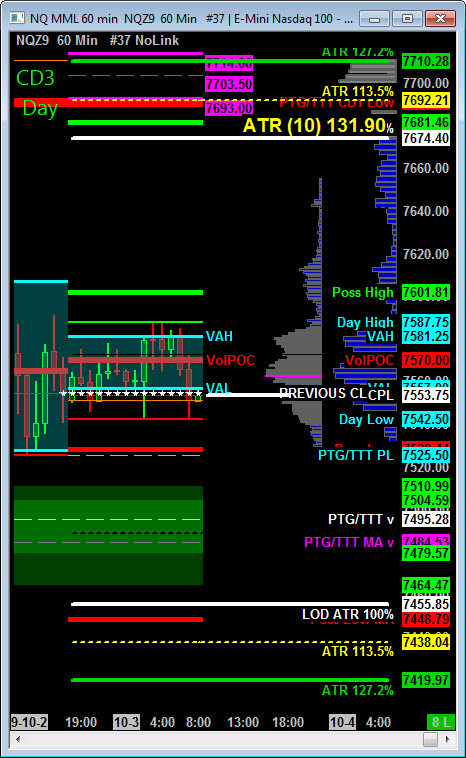
Today is Cycle Day 3…Selling pressure continues to keep a lid on Bull’s attempt to rally price. Long liquidation in prior session weighing on price into today’s session. Bears have ball control and it is theirs to lose.
CD3 Range High = 7602.00 CD3 Range Low = 7528.00 CD3 Range Avg = 139.00
Scenario 1: IF Bulls hold bid above 7555, THEN initial upside potential targets 7582 – 7602 zone..
Scenario 2: IF Bears hold offer below 7555, THEN initial downside targets 7528 – 7510 zone..
Range Projections and Key Levels (NQ) September (U) Contract
HOD ATR Range Projection: 7675.00; LOD ATR Range Projection: 7456.00; Cycle Day 1 Low: 7691.00; 3 Day Central Pivot: 7693.00; 3 Day Cycle Target: 7762.00; 10 Day Average True Range: 132.00; VIX: 20.28
Trade Strategy: Our tactical trade strategy will simply remain unaltered…We’ll be flexible to trade both long and short side from Decision Pivot Levels. Continue to focus on Bull/Bear Stackers and Premium/Discounts. As always, remaining in alignment with dominant intra-day force increases probabilities of producing winning trades.
Stay Focused…Non-Biased…Disciplined ALWAYS USE STOPS!
Good Trading…David
“Knowing is not enough, We must APPLY. Willing is not enough, We must DO.” –Bruce Lee
*****This trade strategy report is disseminated for “education only” and should not be viewed in any way as a recommendation to buy or sell futures products.”
PAST PERFORMANCE IS NOT NECESSARILY INDICATIVE OF FUTURE RESULTS
IMPORTANT NOTICE! No representation is being made that the use of this strategy or any system or trading methodology will generate profits. Past performance is not necessarily indicative of future results. There is substantial risk of loss associated with trading securities and options on equities. Only risk capital should be used to trade. Trading securities is not suitable for everyone.
Disclaimer: Futures, Options, and Currency trading all have large potential rewards, but they also have large potential risk. You must be aware of the risks and be willing to accept them in order to invest in these markets. Don’t trade with money you can’t afford to lose.
This website is neither a solicitation nor an offer to Buy/Sell futures, options, or currencies. No representation is being made that any account will or is likely to achieve profits or losses similar to those discussed on this web site. The past performance of any trading system or methodology is not necessarily indicative of future results.
CFTC RULE 4.41 –HYPOTHETICAL OR SIMULATED PERFORMANCE RESULTS HAVE CERTAIN LIMITATIONS. UNLIKE AN ACTUAL PERFORMANCE RECORD, SIMULATED RESULTS DO NOT REPRESENT ACTUAL TRADING. ALSO, SINCE THE TRADES HAVE NOT BEEN EXECUTED, THE RESULTS MAY HAVE UNDER-OR-OVER COMPENSATED FOR THE IMPACT, IF ANY, OF CERTAIN MARKET FACTORS, SUCH AS LACK OF LIQUIDITY. SIMULATED TRADING PROGRAMS IN GENERAL ARE ALSO SUBJECT TO THE FACT THAT THEY ARE DESIGNED WITH THE BENEFIT OF HINDSIGHT. NO REPRESENTATION IS BEING MADE THAT ANY ACCOUNT WILL OR IS LIKELY TO ACHIEVE PROFIT OR LOSSES SIMILAR TO THOSE SHOWN