
Markets

Not much movement was seen from futures overnight, with contracts tied to the Dow and S&P 500 dipping slightly and the Nasdaq inching up.
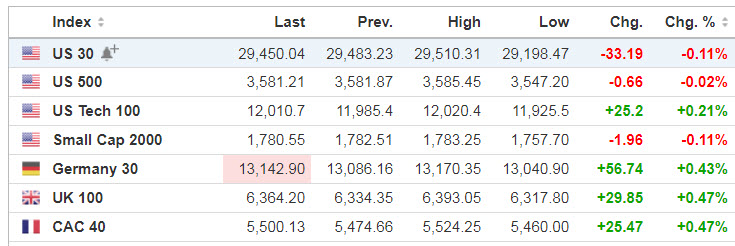
Source: SeekingAlpha.com
Economic Calendar
1:00 PM Baker-Hughes Rig Count

9:00 Fed’s Barkin Speech
9:00 Fed’s Bostic Speech
9:30 Fed’s Kaplan Speech
https://www.investing.com/economic-calendar/
***New: PTG Trading Room Chat Log’s Link
S&P 500

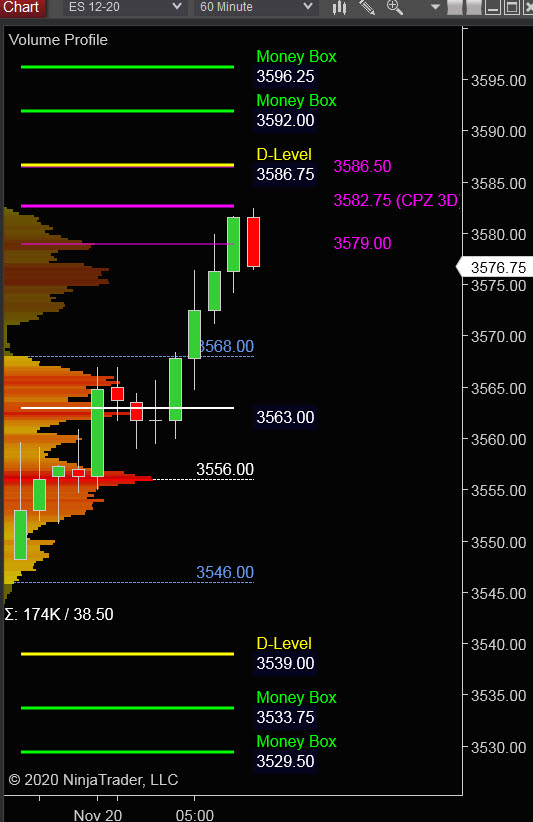
Prior Session was Cycle Day 1 (CD1): Price “flip-flopped” around CD1 Average Decline Target (3557), which was also the Line-in-Sand (LIS). Successful testing of both upper and lower range edges settled price mid-range. Range was 40.50 handles on 1.239M contracts exchanged.
…Transition from Cycle Day 1 to Cycle Day 2
This leads us into Cycle Day 2 (CD2): Normal for CD2 is for some ‘back n fill’ consolidation to absorb and balance recent price swings. Price successfully tested CD1 Low (3542.25) for surety, at which time this cycle’s rally began, currently trading past 3-day Cycle Target (3575) and into 3-day Central Pivot Zone (3579 – 3587). As such, there are two estimated scenarios to consider for today’s trading.
1.) Price sustains a bid above 3575, initially targets 3583 – 3587 zone.
2.) Price sustains an offer below 3575, initially targets 3565 – 3563 zone.
*****3 Day Cycle has a 91% probability of fulfilling Positive Statistic covering 12 years of recorded tracking history.
PVA High Edge = 3568 PVA Low Edge = 3550 Prior POC = 3560
Range Projections and Key Levels (ES) December 2020 (Z) Contract
HOD ATR Range Projection: 3600; LOD ATR Range Projection: 3527; 3 Day Central Pivot: 3583; 3 Day Cycle Target: 3575; 10 Day Average True Range 56; VIX: 23
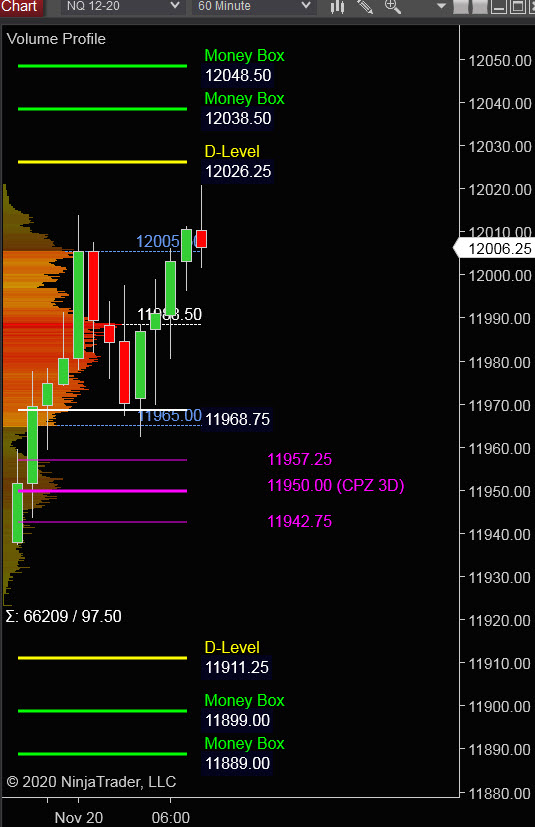
Nasdaq 100 (NQ)

Today is Cycle Day 2 (CD2)…Price is trading above prior value zone during overnight activity. Prior Range was 195 handles on 419k contracts exchanged. As such, there are two estimated scenarios to consider for today’s trading.
PVA High Edge = 11968 PVA Low Edge = 11868 Prior POC = 11940
Bull Scenario: IF Bulls sustain a bid above 11968, THEN initial upside estimate targets 12000 – 12025 zone.
Bear Scenario: IF Bears sustain an offer below 11968, THEN initial downside estimate targets 11950 – 11940 zone.
Range Projections and Key Levels (NQ) December 2020 (Z) Contract
HOD ATR Range Projection: 12140; LOD ATR Range Projection: 11805; 3 Day Central Pivot: 11950; 3 Day Cycle Target: 11895; 10 Day Average True Range: 216; VIX: 23
Trade Strategy: Our tactical trade strategy will simply remain unaltered…We’ll be flexible to trade both long and short side from Decision Pivot Levels. Continue to focus on Bull/Bear Stackers and Premium/Discounts. As always, remaining in alignment with dominant intra-day force increases probabilities of producing winning trades.
Stay Focused…Non-Biased…Disciplined ALWAYS USE STOPS!
Good Trading…David
“Knowing is not enough, We must APPLY. Willing is not enough, We must DO.” –Bruce Lee
*****This trade strategy report is disseminated for “education only” and should not be viewed in any way as a recommendation to buy or sell futures products.”
PAST PERFORMANCE IS NOT NECESSARILY INDICATIVE OF FUTURE RESULTS
IMPORTANT NOTICE! No representation is being made that the use of this strategy or any system or trading methodology will generate profits. Past performance is not necessarily indicative of future results. There is substantial risk of loss associated with trading securities and options on equities. Only risk capital should be used to trade. Trading securities is not suitable for everyone.
Disclaimer: Futures, Options, and Currency trading all have large potential rewards, but they also have large potential risk. You must be aware of the risks and be willing to accept them in order to invest in these markets. Don’t trade with money you can’t afford to lose.
This website is neither a solicitation nor an offer to Buy/Sell futures, options, or currencies. No representation is being made that any account will or is likely to achieve profits or losses similar to those discussed on this web site. The past performance of any trading system or methodology is not necessarily indicative of future results.
CFTC RULE 4.41 –HYPOTHETICAL OR SIMULATED PERFORMANCE RESULTS HAVE CERTAIN LIMITATIONS. UNLIKE AN ACTUAL PERFORMANCE RECORD, SIMULATED RESULTS DO NOT REPRESENT ACTUAL TRADING. ALSO, SINCE THE TRADES HAVE NOT BEEN EXECUTED, THE RESULTS MAY HAVE UNDER-OR-OVER COMPENSATED FOR THE IMPACT, IF ANY, OF CERTAIN MARKET FACTORS, SUCH AS LACK OF LIQUIDITY. SIMULATED TRADING PROGRAMS IN GENERAL ARE ALSO SUBJECT TO THE FACT THAT THEY ARE DESIGNED WITH THE BENEFIT OF HINDSIGHT. NO REPRESENTATION IS BEING MADE THAT ANY ACCOUNT WILL OR IS LIKELY TO ACHIEVE PROFIT OR LOSSES SIMILAR TO THOSE SHOWN