
Markets
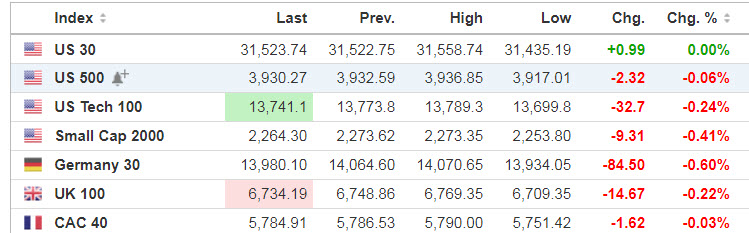
Source: SeekingAlpha.com
Economic Calendar
8:30 Producer Price Index
8:30 Retail Sales
8:55 Redbook Chain Store Sales
9:00 Fed’s Barkin Speech
9:15 Industrial Production
10:00 Fed’s Rosengren Speech
10:00 Business Inventories
10:00 NAHB Housing Market Index
1:00 PM Results of $27B, 20-Year Bond Auction
2:00 PM FOMC Minutes
https://www.investing.com/economic-calendar/
***New: PTG Trading Room Chat Log’s Link
S&P 500

***Written 8 pm Tuesday evening for Wednesday’s trading for contribution to MrTopStep’s “The Opening Print” publication.
Tuesday’s Session was Cycle Day 2 (CD2): Because of the holiday shortened session, the normally expected decline for Cycle Day 1 was delayed into Cycle Day 2 Morning Session. The Afternoon Session reflected a normal Cycle Day 2 consolidation type trade. Market on Close Buy Imbalance was $1.1 Billion. Range was 40.50 handles on 1.287M contracts exchanged.
…Transition from Cycle Day 2 to Cycle Day 3
This leads us into Cycle Day 3 (CD3): Price is currently (as of the close) below Cycle Day 1 Low (3947). We would be expecting some magnitude rally for this CD3 to recover the CD1 Low. As such, there are two estimated scenarios to consider for today’s trading.
1.) Price sustains a bid above 3930, initially targets 3940 – 3945 zone.
2.) Price sustains an offer below 3930, initially targets 3815 – 3910 zone.
*****3 Day Cycle has a 91% probability of fulfilling Positive Statistic covering 12 years of recorded tracking history.
PVA High Edge = 3937 PVA Low Edge = 3924 Prior POC = 3930
Range Projections and Key Levels (ES) March 2021 (H) Contract
HOD ATR Range Projection: 3944; LOD ATR Range Projection: 3900; 3 Day Central Pivot: 3933; 3 Day Cycle Target: 3998; 10 Day Average True Range 31; VIX: 21

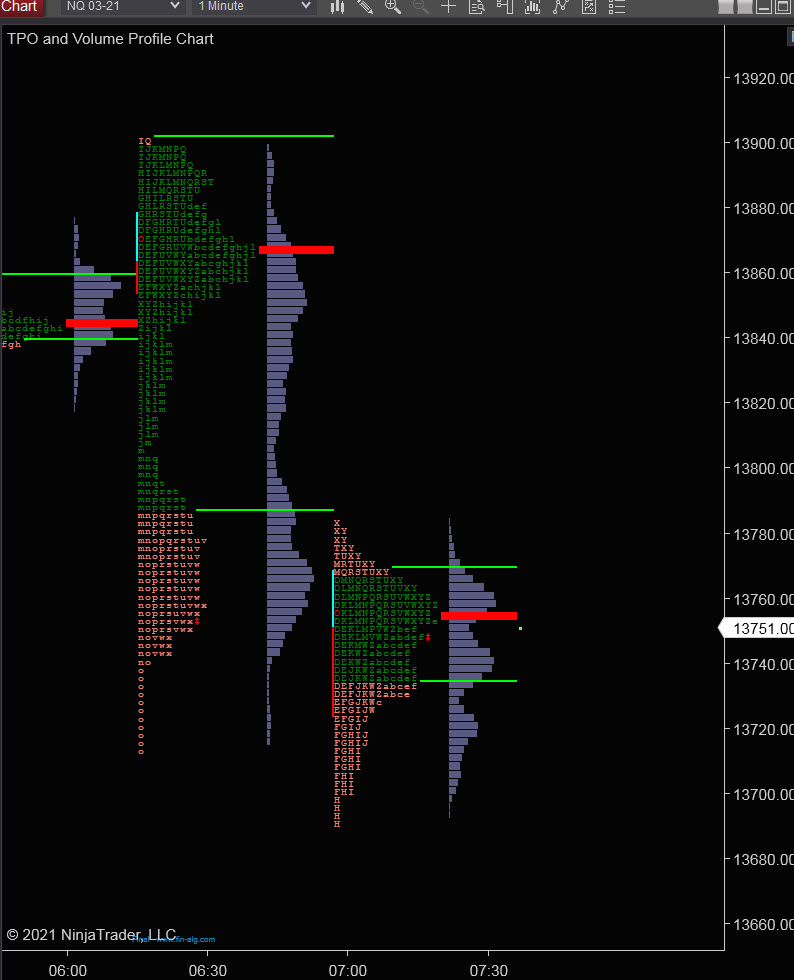
Nasdaq 100 (NQ)

Today is Cycle Day 3 (CD3)…Price is currently trading inside of prior value zone. Prior range was 184 handles on 535k contracts exchanged. As such, there are two estimated scenarios to consider for today’s trading.
PVA High Edge = 13846 PVA Low Edge = 13745 Prior POC = 13770
Bull Scenario: IF Bulls sustain a bid above 13745, THEN initial upside estimate targets 13770 – 13785 zone.
Bear Scenario: IF Bears sustain an offer below 13745, THEN initial downside estimate targets 13715 – 13700 zone.
Range Projections and Key Levels (NQ) March 2021 (H) Contract
HOD ATR Range Projection: 13833; LOD ATR Range Projection: 13645; 3 Day Central Pivot: 13799; 3 Day Cycle Target: 13905; 10 Day Average True Range: 139; VIX: 21
Trade Strategy: Our tactical trade strategy will simply remain unaltered…We’ll be flexible to trade both long and short side from Decision Pivot Levels. Continue to focus on Bull/Bear Stackers and Premium/Discounts. As always, remaining in alignment with dominant intra-day force increases probabilities of producing winning trades.
Stay Focused…Non-Biased…Disciplined ALWAYS USE STOPS!
Good Trading…David
“Knowing is not enough, We must APPLY. Willing is not enough, We must DO.” –Bruce Lee
*****This trade strategy report is disseminated for “education only” and should not be viewed in any way as a recommendation to buy or sell futures products.”
PAST PERFORMANCE IS NOT NECESSARILY INDICATIVE OF FUTURE RESULTS
IMPORTANT NOTICE! No representation is being made that the use of this strategy or any system or trading methodology will generate profits. Past performance is not necessarily indicative of future results. There is substantial risk of loss associated with trading securities and options on equities. Only risk capital should be used to trade. Trading securities is not suitable for everyone.
Disclaimer: Futures, Options, and Currency trading all have large potential rewards, but they also have large potential risk. You must be aware of the risks and be willing to accept them in order to invest in these markets. Don’t trade with money you can’t afford to lose.
This website is neither a solicitation nor an offer to Buy/Sell futures, options, or currencies. No representation is being made that any account will or is likely to achieve profits or losses similar to those discussed on this web site. The past performance of any trading system or methodology is not necessarily indicative of future results.
CFTC RULE 4.41 –HYPOTHETICAL OR SIMULATED PERFORMANCE RESULTS HAVE CERTAIN LIMITATIONS. UNLIKE AN ACTUAL PERFORMANCE RECORD, SIMULATED RESULTS DO NOT REPRESENT ACTUAL TRADING. ALSO, SINCE THE TRADES HAVE NOT BEEN EXECUTED, THE RESULTS MAY HAVE UNDER-OR-OVER COMPENSATED FOR THE IMPACT, IF ANY, OF CERTAIN MARKET FACTORS, SUCH AS LACK OF LIQUIDITY. SIMULATED TRADING PROGRAMS IN GENERAL ARE ALSO SUBJECT TO THE FACT THAT THEY ARE DESIGNED WITH THE BENEFIT OF HINDSIGHT. NO REPRESENTATION IS BEING MADE THAT ANY ACCOUNT WILL OR IS LIKELY TO ACHIEVE PROFIT OR LOSSES SIMILAR TO THOSE SHOWN