
Markets
The stock market record highs seem to have fizzled in recent days, with the S&P 500 falling for a third straight day on Thursday. Fears of inflation may be at work amid concerns that if all the stimulus being pumped into the financial system works (i.e., people start spending, shopping etc.), that could begin pushing up prices.
That may be risky for stock investors as money flows back into the rising yield bond market. In fact, a sizable selloff has been seen in the U.S. government bond market over the past six weeks, with yields on the 10-year Treasury note climbing from 1% in early January to 1.3% this week (yields move inversely to price).

Source: SeekingAlpha.com
Economic Calendar
9:45 PMI Composite Flash
10:00 Existing Home Sales
10:00 E-Commerce Retail Sales
10:00 Quarterly Services Report
11:00 Fed’s Rosengren Speech
1:00 PM Baker-Hughes Rig Count
***New: PTG Trading Room Chat Log’s Link
S&P 500

Prior Session was Cycle Day 1 (CD1): It was a “normal” CD1 as price declined as expected fulfilling the Average Range Decline to 3882, as which time reversal unfolded pushing price to close at mid-range. Range was 55.50 handles on 1.497M contracts exchanged.
…Transition from Cycle Day 1 to Cycle Day 2
This leads us into Cycle Day 2 (CD2): Price pulled back during overnight trade to successfully test P-VAL (3893) as buyers aggressively bid price higher trading back near 3920 3 Day Central Pivot Zone. As such, there are two estimated scenarios to consider for today’s trading.
1.) Price sustains a bid above 3920, initially targets 3933 – 3936 zone.
2.) Price sustains an offer below 3920, initially targets 3910 – 3905 zone.
*****3 Day Cycle has a 91% probability of fulfilling Positive Statistic covering 12 years of recorded tracking history.
PVA High Edge = 3918 PVA Low Edge = 3893 Prior POC = 3910
Range Projections and Key Levels (ES) March 2021 (H) Contract
HOD ATR Range Projection: 3922; LOD ATR Range Projection: 3897; 3 Day Central Pivot: 3920; 3 Day Cycle Target: 3933; 10 Day Average True Range 32; VIX: 22

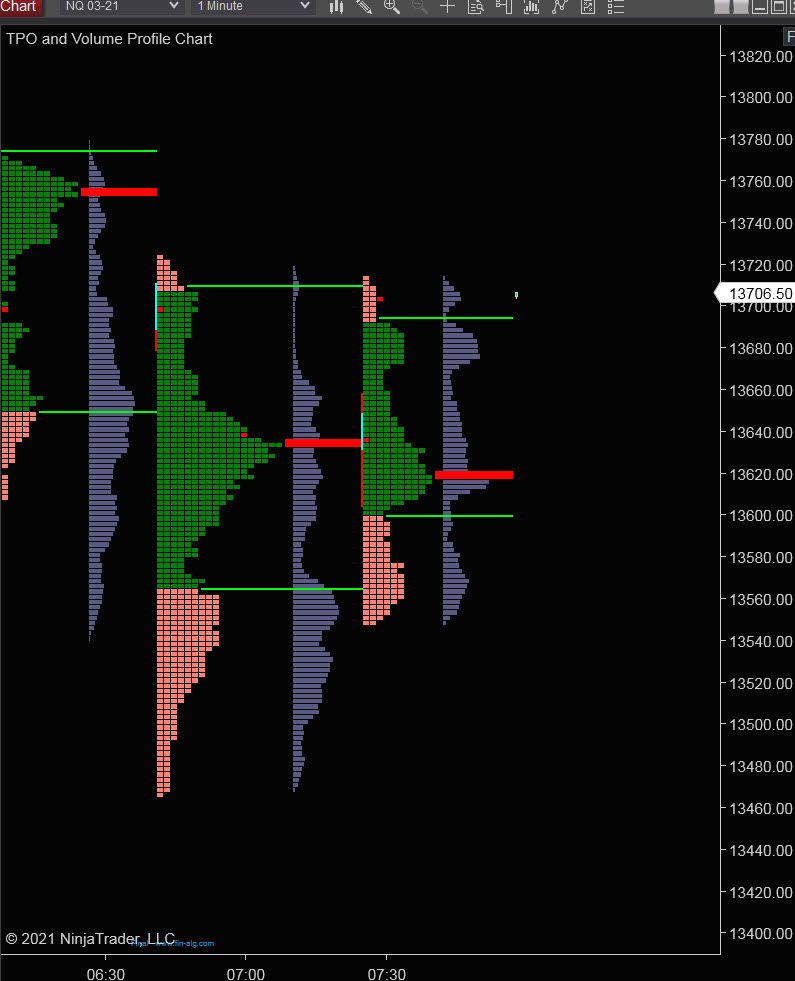
Nasdaq 100 (NQ)

Today is Cycle Day 2 (CD2)…Price is currently trading near 13707 fulfilling CD2 price target during pre-RTH trade session. Prior Range was 255 handles on 563k contracts exchanged. As such, there are two estimated scenarios to consider for today’s trading.
PVA High Edge = 13612 PVA Low Edge = 13474 Prior POC = 13553
Bull Scenario: IF Bulls sustain a bid above 13675, THEN initial upside estimate targets 13725 – 13750 zone.
Bear Scenario: IF Bears sustain an offer below 13675, THEN initial downside estimate targets 13655 – 13620 zone.
Range Projections and Key Levels (NQ) March 2021 (H) Contract
HOD ATR Range Projection: 13702; LOD ATR Range Projection: 13563; 3 Day Central Pivot: 13690; 3 Day Cycle Target: 13707; 10 Day Average True Range: 152; VIX: 22
Trade Strategy: Our tactical trade strategy will simply remain unaltered…We’ll be flexible to trade both long and short side from Decision Pivot Levels. Continue to focus on Bull/Bear Stackers and Premium/Discounts. As always, remaining in alignment with dominant intra-day force increases probabilities of producing winning trades.
Stay Focused…Non-Biased…Disciplined ALWAYS USE STOPS!
Good Trading…David
“Knowing is not enough, We must APPLY. Willing is not enough, We must DO.” –Bruce Lee
*****This trade strategy report is disseminated for “education only” and should not be viewed in any way as a recommendation to buy or sell futures products.”
PAST PERFORMANCE IS NOT NECESSARILY INDICATIVE OF FUTURE RESULTS
IMPORTANT NOTICE! No representation is being made that the use of this strategy or any system or trading methodology will generate profits. Past performance is not necessarily indicative of future results. There is substantial risk of loss associated with trading securities and options on equities. Only risk capital should be used to trade. Trading securities is not suitable for everyone.
Disclaimer: Futures, Options, and Currency trading all have large potential rewards, but they also have large potential risk. You must be aware of the risks and be willing to accept them in order to invest in these markets. Don’t trade with money you can’t afford to lose.
This website is neither a solicitation nor an offer to Buy/Sell futures, options, or currencies. No representation is being made that any account will or is likely to achieve profits or losses similar to those discussed on this web site. The past performance of any trading system or methodology is not necessarily indicative of future results.
CFTC RULE 4.41 –HYPOTHETICAL OR SIMULATED PERFORMANCE RESULTS HAVE CERTAIN LIMITATIONS. UNLIKE AN ACTUAL PERFORMANCE RECORD, SIMULATED RESULTS DO NOT REPRESENT ACTUAL TRADING. ALSO, SINCE THE TRADES HAVE NOT BEEN EXECUTED, THE RESULTS MAY HAVE UNDER-OR-OVER COMPENSATED FOR THE IMPACT, IF ANY, OF CERTAIN MARKET FACTORS, SUCH AS LACK OF LIQUIDITY. SIMULATED TRADING PROGRAMS IN GENERAL ARE ALSO SUBJECT TO THE FACT THAT THEY ARE DESIGNED WITH THE BENEFIT OF HINDSIGHT. NO REPRESENTATION IS BEING MADE THAT ANY ACCOUNT WILL OR IS LIKELY TO ACHIEVE PROFIT OR LOSSES SIMILAR TO THOSE SHOWN