
Markets
Jitters over the virus are sending investors to safe haven assets following another upward revision in cases, which now stand at 75,465 in China and 2,236 deaths nationwide. U.S. equity futures slipped 0.5% and oil fell nearly 2%, though gold remains on a tear, rising 1.1% to $1638/oz.
In Asia, Japan -0.4%. Hong Kong -1.1%. China +0.3%. India closed.
In Europe, at midday, London -0.2%. Paris -0.1%. Frankfurt flat.
Futures at 6:20, Dow -0.5%. S&P -0.5%. Nasdaq -0.6%. Crude -1.9% to $52.84 Gold +1.1% to $1637.80. Bitcoin +1.2% to $9720.
Ten-year Treasury Yield -3 bps to 1.49%
Source: Seeking Alpha https://seekingalpha.com/
Economic Calendar
9:45 PMI Composite Flash
10:00 Existing Home Sales 1:00 PM Baker-Hughes Rig Count
https://www.investing.com/economic-calendar/
***New: PTG Trading Room Chat Log’s Link
S&P 500
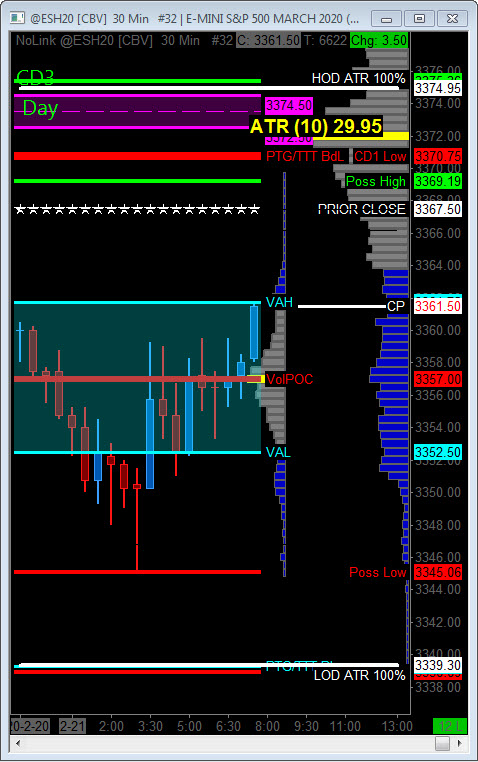
Today is Cycle Day 3 (CD3)…Price having fulfilled upside range projections on CD1 received a sharp rejection on subsequent attempts to auction higher. 11 am reversal sent price plummeting 47 handles before recovering back to 3373 5-day Point of Control.
Price is currently below Cycle Day 1 Low (3370.75) with an objective to recover back “at or above” before end of session to fulfill Cycle Statistic.
Range High = 3369.00 Range Low = 3345.00 CD3 Range Avg = 30.50
Bull Scenario: IF Bulls hold bid above 3357, THEN initial upside targets 3367 – 3372 zone.
Bear Scenario: IF Bears hold offer below 3357, THEN initial downside targets 3350 – 3345 zone.
Range Projections and Key Levels (ES) March 2020 (H) Contract
HOD ATR Range Projection: 3375.00; LOD ATR Range Projection: 3339.00; 3 Day Central Pivot: 3373.00; 3 Day Cycle Target: 3399.50; 10 Day Average True Range 30.00; VIX: 16.86
Nasdaq 100 (NQ)
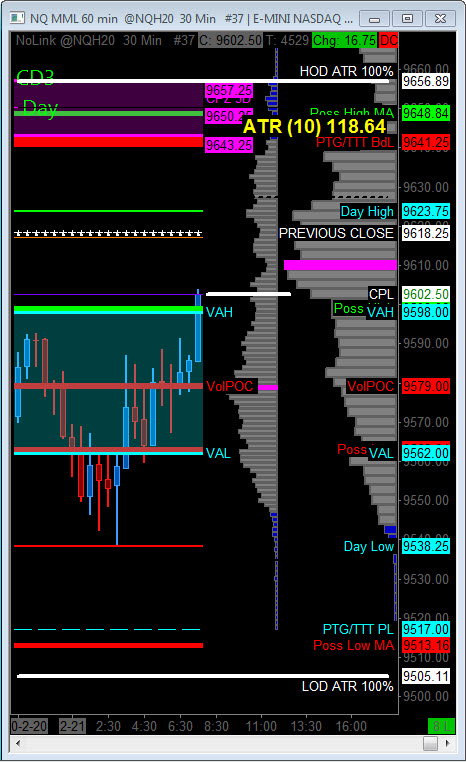
Today is Cycle Day 3 (CD3)…Price is currently below Cycle Day 1 Low (9641.25) and will need to recover “at or above” before end of session to fulfill Cycle Statistic.
CD3 Range High = 9598.00 CD3 Range Low = 9562.00 CD3 Range Avg = 110.50
Bull Scenario: IF Bulls hold bid above 9579, THEN initial upside targets 9598 – 9612 zone.
Bear Scenario: IF Bears hold offer below 9579, THEN initial downside targets 9562 – 9548 zone.
Range Projections and Key Levels (NQ) March 2020 (H) Contract
HOD ATR Range Projection: 9657.00; LOD ATR Range Projection: 9505.00; 3 Day Central Pivot: 9650.00; 3 Day Cycle Target: 9715.00; 10 Day Average True Range: 119.00; VIX: 16.86
Trade Strategy: Our tactical trade strategy will simply remain unaltered…We’ll be flexible to trade both long and short side from Decision Pivot Levels. Continue to focus on Bull/Bear Stackers and Premium/Discounts. As always, remaining in alignment with dominant intra-day force increases probabilities of producing winning trades.
Stay Focused…Non-Biased…Disciplined ALWAYS USE STOPS!
Good Trading…David
“Knowing is not enough, We must APPLY. Willing is not enough, We must DO.” –Bruce Lee
*****This trade strategy report is disseminated for “education only” and should not be viewed in any way as a recommendation to buy or sell futures products.”
PAST PERFORMANCE IS NOT NECESSARILY INDICATIVE OF FUTURE RESULTS
IMPORTANT NOTICE! No representation is being made that the use of this strategy or any system or trading methodology will generate profits. Past performance is not necessarily indicative of future results. There is substantial risk of loss associated with trading securities and options on equities. Only risk capital should be used to trade. Trading securities is not suitable for everyone.
Disclaimer: Futures, Options, and Currency trading all have large potential rewards, but they also have large potential risk. You must be aware of the risks and be willing to accept them in order to invest in these markets. Don’t trade with money you can’t afford to lose.
This website is neither a solicitation nor an offer to Buy/Sell futures, options, or currencies. No representation is being made that any account will or is likely to achieve profits or losses similar to those discussed on this web site. The past performance of any trading system or methodology is not necessarily indicative of future results.
CFTC RULE 4.41 –HYPOTHETICAL OR SIMULATED PERFORMANCE RESULTS HAVE CERTAIN LIMITATIONS. UNLIKE AN ACTUAL PERFORMANCE RECORD, SIMULATED RESULTS DO NOT REPRESENT ACTUAL TRADING. ALSO, SINCE THE TRADES HAVE NOT BEEN EXECUTED, THE RESULTS MAY HAVE UNDER-OR-OVER COMPENSATED FOR THE IMPACT, IF ANY, OF CERTAIN MARKET FACTORS, SUCH AS LACK OF LIQUIDITY. SIMULATED TRADING PROGRAMS IN GENERAL ARE ALSO SUBJECT TO THE FACT THAT THEY ARE DESIGNED WITH THE BENEFIT OF HINDSIGHT. NO REPRESENTATION IS BEING MADE THAT ANY ACCOUNT WILL OR IS LIKELY TO ACHIEVE PROFIT OR LOSSES SIMILAR TO THOSE SHOWN