
Markets
The biggest monthly rise in bond yields since 2016 injected fresh uncertainty into the market, bruising technology stocks and triggering volatility streaks that saw the DJIA swing more than 1,000 points over three days. Things appear to be turning around this morning as the 10-year Treasury yield fell 4 bps to 1.4%. Futures: Dow +1%; S&P 500 +1.1%; Nasdaq +1.5%.
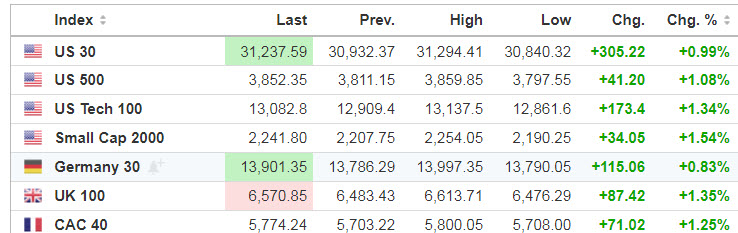
Source: SeekingAlpha.com
Economic Calendar
9:45 PMI Manufacturing Index
10:00 ISM Manufacturing Index
10:00 Construction Spending
***New: PTG Trading Room Chat Log’s Link
S&P 500

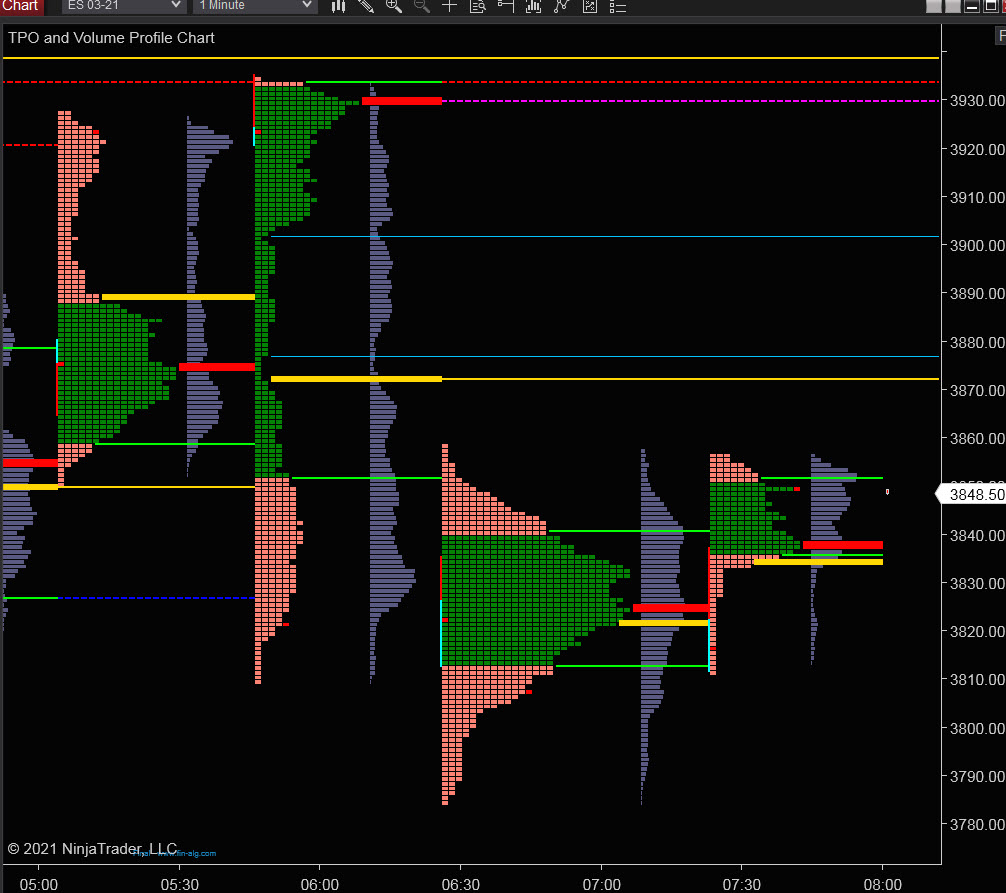
Prior Session was Cycle Day 1 (CD1): It was a “normal” CD1 as price declined early, with CD1 Low (3785). Subsequent rally pushed price to mid-day high before relinquishing morning gains by the month-end close. Range was 73.50 handles on 2.719M contracts exchanged.
…Transition from Cycle Day 1 to Cycle Day 2
This leads us into Cycle Day 2 (CD2): March opens with a rally during GLOBEX fulfilling 3840 price objective and tagging the 3 Day Central Pivot Zone (3853 – 3861). As such, there are two estimated scenarios to consider for today’s trading.
1.) Price sustains a bid above 3845, initially targets 3860 – 3870 zone.
2.) Price sustains an offer below 3845, initially targets 3830 – 3825 zone.
*****3 Day Cycle has a 91% probability of fulfilling Positive Statistic covering 12 years of recorded tracking history.
PVA High Edge = 3845 PVA Low Edge = 3818 Prior POC = 3840
Range Projections and Key Levels (ES) March 2021 (H) Contract
HOD ATR Range Projection: 3866; LOD ATR Range Projection: 3803; 3 Day Central Pivot: 3920; 3 Day Cycle Target: 3858; 10 Day Average True Range 54; VIX: 25
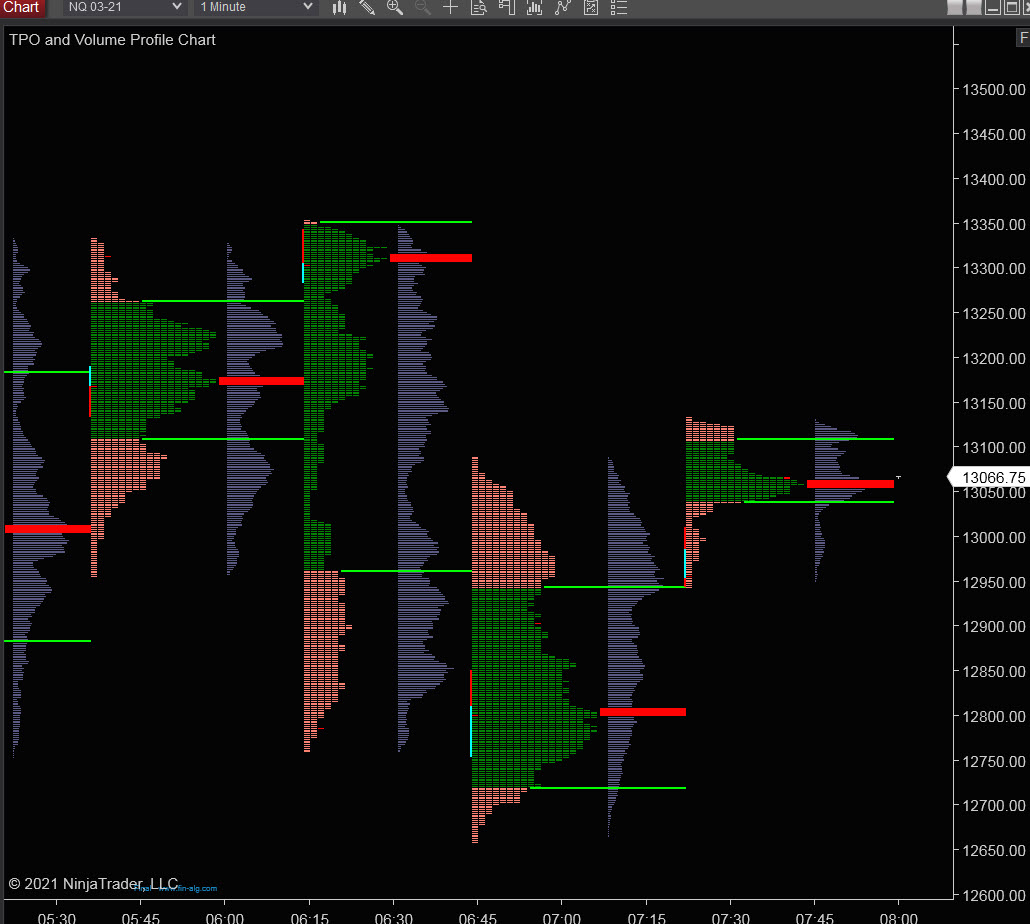
Nasdaq 100 (NQ)

Today is Cycle Day 2 (CD2)…Price is currently trading near 13120 fulfilling CD2 Penetration Level during pre-RTH trade session. Prior Range was 427 handles on 801k contracts exchanged. As such, there are two estimated scenarios to consider for today’s trading.
PVA High Edge = 13056 PVA Low Edge = 12844 Prior POC = 12950
Bull Scenario: IF Bulls sustain a bid above 13056, THEN initial upside estimate targets 13120 – 13154 zone.
Bear Scenario: IF Bears sustain an offer below 13056, THEN initial downside estimate targets 13000 – 12950 zone.
Range Projections and Key Levels (NQ) March 2021 (H) Contract
HOD ATR Range Projection: 13240; LOD ATR Range Projection: 12840; 3 Day Central Pivot: 13017; 3 Day Cycle Target: 12918; 10 Day Average True Range: 293; VIX: 25
Trade Strategy: Our tactical trade strategy will simply remain unaltered…We’ll be flexible to trade both long and short side from Decision Pivot Levels. Continue to focus on Bull/Bear Stackers and Premium/Discounts. As always, remaining in alignment with dominant intra-day force increases probabilities of producing winning trades.
Stay Focused…Non-Biased…Disciplined ALWAYS USE STOPS!
Good Trading…David
“Knowing is not enough, We must APPLY. Willing is not enough, We must DO.” –Bruce Lee
*****This trade strategy report is disseminated for “education only” and should not be viewed in any way as a recommendation to buy or sell futures products.”
PAST PERFORMANCE IS NOT NECESSARILY INDICATIVE OF FUTURE RESULTS
IMPORTANT NOTICE! No representation is being made that the use of this strategy or any system or trading methodology will generate profits. Past performance is not necessarily indicative of future results. There is substantial risk of loss associated with trading securities and options on equities. Only risk capital should be used to trade. Trading securities is not suitable for everyone.
Disclaimer: Futures, Options, and Currency trading all have large potential rewards, but they also have large potential risk. You must be aware of the risks and be willing to accept them in order to invest in these markets. Don’t trade with money you can’t afford to lose.
This website is neither a solicitation nor an offer to Buy/Sell futures, options, or currencies. No representation is being made that any account will or is likely to achieve profits or losses similar to those discussed on this web site. The past performance of any trading system or methodology is not necessarily indicative of future results.
CFTC RULE 4.41 –HYPOTHETICAL OR SIMULATED PERFORMANCE RESULTS HAVE CERTAIN LIMITATIONS. UNLIKE AN ACTUAL PERFORMANCE RECORD, SIMULATED RESULTS DO NOT REPRESENT ACTUAL TRADING. ALSO, SINCE THE TRADES HAVE NOT BEEN EXECUTED, THE RESULTS MAY HAVE UNDER-OR-OVER COMPENSATED FOR THE IMPACT, IF ANY, OF CERTAIN MARKET FACTORS, SUCH AS LACK OF LIQUIDITY. SIMULATED TRADING PROGRAMS IN GENERAL ARE ALSO SUBJECT TO THE FACT THAT THEY ARE DESIGNED WITH THE BENEFIT OF HINDSIGHT. NO REPRESENTATION IS BEING MADE THAT ANY ACCOUNT WILL OR IS LIKELY TO ACHIEVE PROFIT OR LOSSES SIMILAR TO THOSE SHOWN