
Markets
U.S. stock index futures wavered overnight, currently down around 0.2%, after a major session for Wall Street yesterday that saw the S&P 500 surge almost 1% to its first record close since April. Iran is as good excuse as any for the slight pullback this morning, with reports suggesting President Trump ordered, and then rescinded, an airstrike on military installations in the Islamic Republic. Oil prices are adding to yesterday’s massive 6% jump as WTI tops $57 a barrel, while gold dips 0.3% after spiking above $1,400 per ounce to prices not seen in nearly six years.
Source: Seeking Alpha https://seekingalpha.com/
9:45PMI Composite Flash
10:00Existing Home Sales
12:00 PMFed’s Brainard Speech
12:00 PMFed’s Mester Speech
12:30 PMFed’s Maly Speech
1:00 PMBaker-Hughes Rig Count
10:00Fed’s Harker Speech on Sunday
***New: PTG Trading Room Chat Log’s Link
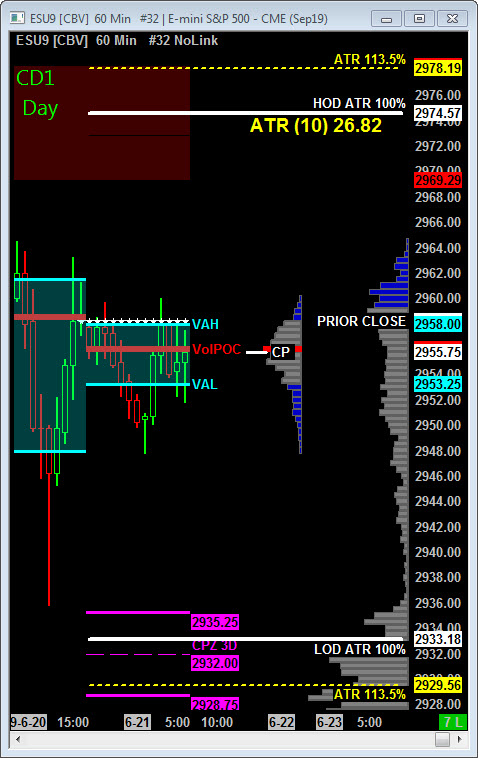
S&P 500
Today is Cycle Day 1 (CD1)…Normal is for a decline measuring 2932.00. Average Range for CD1 is 33.00 handles. Odds of decline > 10 handles = 73% Odds of decline > 20 = 43%
CD1 Range High = 2972.00 CD1 Range Low = 2936.00 CD1 Range Avg = 33.00
Scenario 1: IF Bulls hold bid above 2956, THEN initial upside targets 2965.00. Conversion of this level opens skylight targeting 2972 – 2976 zone.
Scenario 2: IF Bears hold offer below 2956, THEN initial downside targets 2948 prior Value Area Low. Conversion of this level opens trap door targeting 2936 – 2933 zone.
Range Projections and Key Levels (ES) September 2019 (U) Contract
HOD ATR Range Projection: 2975.00; LOD ATR Range Projection: 2933.00; 3 Day Central Pivot: 2932.00; 3 Day Cycle Target: 2988.00; 10 Day Average True Range 26.82; VIX: 15.00
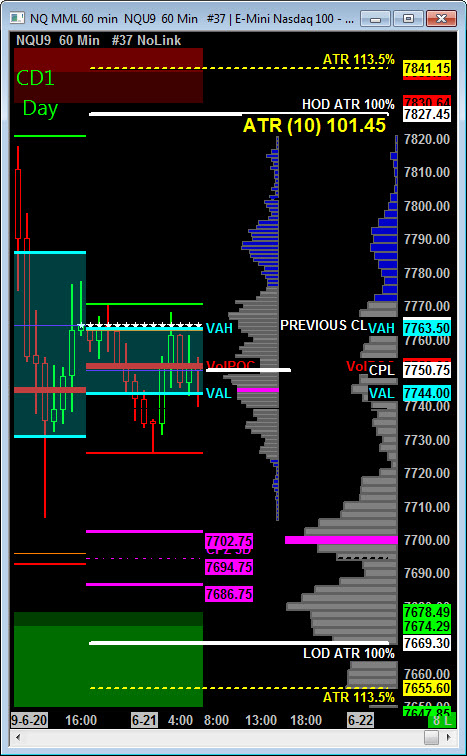
Nasdaq 100 (NQ)
Today is Cycle Day 1 (CD1)…Normal is for a decline measuring 7720.00. Average Range for CD1 is 116.00 handles. Odds of decline > 20 handles = 74% Odds of decline > 25 = 66%
CD1 Range High =7782.00 CD1 Range Low = 7715.00 CD1 Range Avg = 116.00
Scenario 1: IF Bulls hold bid above 7752, THEN initial upside targets 7782 handle.
Scenario 2: IF Bears hold offer below 7752, THEN initial downside targets 7720 handle.
Range Projections and Key Levels (NQ) September 2019 (U) Contract
HOD ATR Range Projection: 7827.00; LOD ATR Range Projection: 7670.00; 3 Day Central Pivot: 7695.00; 3 Day Cycle Target: 7795.00; 10 Day Average True Range: 101.45; VIX: 15.00
Trade Strategy: Our tactical trade strategy will simply remain unaltered…We’ll be flexible to trade both long and short side from Decision Pivot Levels. Continue to focus on Bull/Bear Stackers and Premium/Discounts. As always, remaining in alignment with dominant intra-day force increases probabilities of producing winning trades.
Stay Focused…Non-Biased…Disciplined ALWAYS USE STOPS!
Good Trading…David
“Knowing is not enough, We must APPLY. Willing is not enough, We must DO.” –Bruce Lee
*****This trade strategy report is disseminated for “education only” and should not be viewed in any way as a recommendation to buy or sell futures products.”
PAST PERFORMANCE IS NOT NECESSARILY INDICATIVE OF FUTURE RESULTS
IMPORTANT NOTICE! No representation is being made that the use of this strategy or any system or trading methodology will generate profits. Past performance is not necessarily indicative of future results. There is substantial risk of loss associated with trading securities and options on equities. Only risk capital should be used to trade. Trading securities is not suitable for everyone.
Disclaimer: Futures, Options, and Currency trading all have large potential rewards, but they also have large potential risk. You must be aware of the risks and be willing to accept them in order to invest in these markets. Don’t trade with money you can’t afford to lose.
This website is neither a solicitation nor an offer to Buy/Sell futures, options, or currencies. No representation is being made that any account will or is likely to achieve profits or losses similar to those discussed on this web site. The past performance of any trading system or methodology is not necessarily indicative of future results.
CFTC RULE 4.41 –HYPOTHETICAL OR SIMULATED PERFORMANCE RESULTS HAVE CERTAIN LIMITATIONS. UNLIKE AN ACTUAL PERFORMANCE RECORD, SIMULATED RESULTS DO NOT REPRESENT ACTUAL TRADING. ALSO, SINCE THE TRADES HAVE NOT BEEN EXECUTED, THE RESULTS MAY HAVE UNDER-OR-OVER COMPENSATED FOR THE IMPACT, IF ANY, OF CERTAIN MARKET FACTORS, SUCH AS LACK OF LIQUIDITY. SIMULATED TRADING PROGRAMS IN GENERAL ARE ALSO SUBJECT TO THE FACT THAT THEY ARE DESIGNED WITH THE BENEFIT OF HINDSIGHT. NO REPRESENTATION IS BEING MADE THAT ANY ACCOUNT WILL OR IS LIKELY TO ACHIEVE PROFIT OR LOSSES SIMILAR TO THOSE SHOWN