
Markets
Global markets are sliding after a vaccine-induced rally, with Dow and S&P 500 futures off 0.7% and contracts tied to the Nasdaq down 1.6%.
Source: Seeking Alpha https://seekingalpha.com/
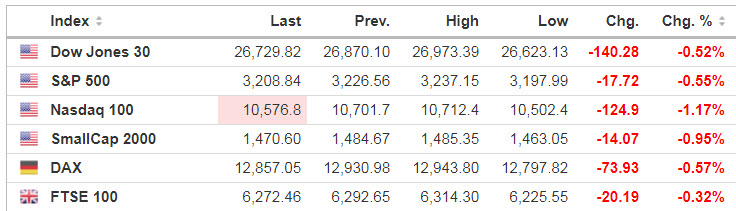
Source: https://www.investing.com/indices/indices-cfds
Economic Calendar
8:30 Initial Jobless Claims
8:30 Philly Fed Business Outlook
8:30 Retail Sales
10:00 Business Inventories
10:00 NAHB Housing Market Index
10:30 EIA Natural Gas Inventory

On the U.S. economic calendar, weekly jobless claims reported today are expected to decline for the 15th week in a row to 1.25M, while retail sales are forecast to have jumped 5% in June.
Source: https://www.investing.com/economic-calendar/
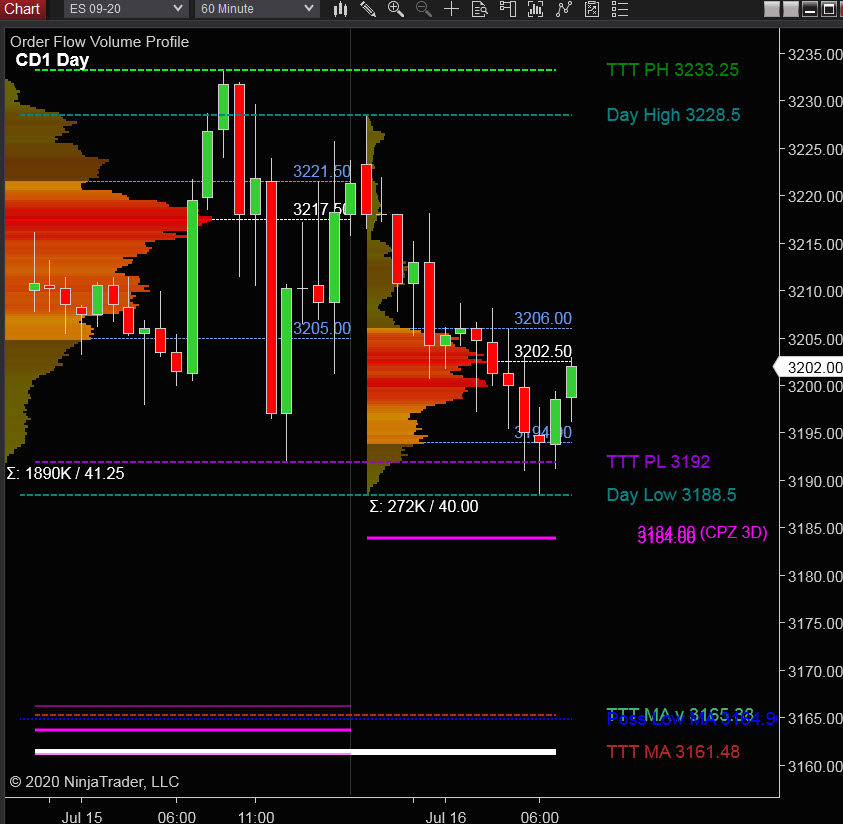
S&P 500 (ES)
Prior Session was Cycle Day 3 (CD3): Positive 3 Day Cycle as price pushed higher fulfilling 3232 CD3 Penetration Level Target, at which time price reversed direction, consolidating throughout the session.
…Transition from Cycle Day 3 to Cycle Day 1
This leads us into Cycle Day 1 (CD1): Normal for CD1 is some magnitude decline with average measuring 3161.50. Bulls remain in firm control as price is consolidating near recent high. We then have two scenarios to consider for today’s trading.
1.) Price sustains a bid above 3192, initially targeting 3207 – 3217 zone.
2.) Price sustains an offer below 3192 initially targeting 3175 – 3165 zone.
P -VA High = 3222 P – VA Low = 3206 P – POC = 3217
Range Projections and Key Levels (ES) September 2020 (U) Contract
HOD ATR Range Projection: 3260; LOD ATR Range Projection: 3176; 3 Day Central Pivot: 3184; 10 Day Average True Range 52; VIX: 28
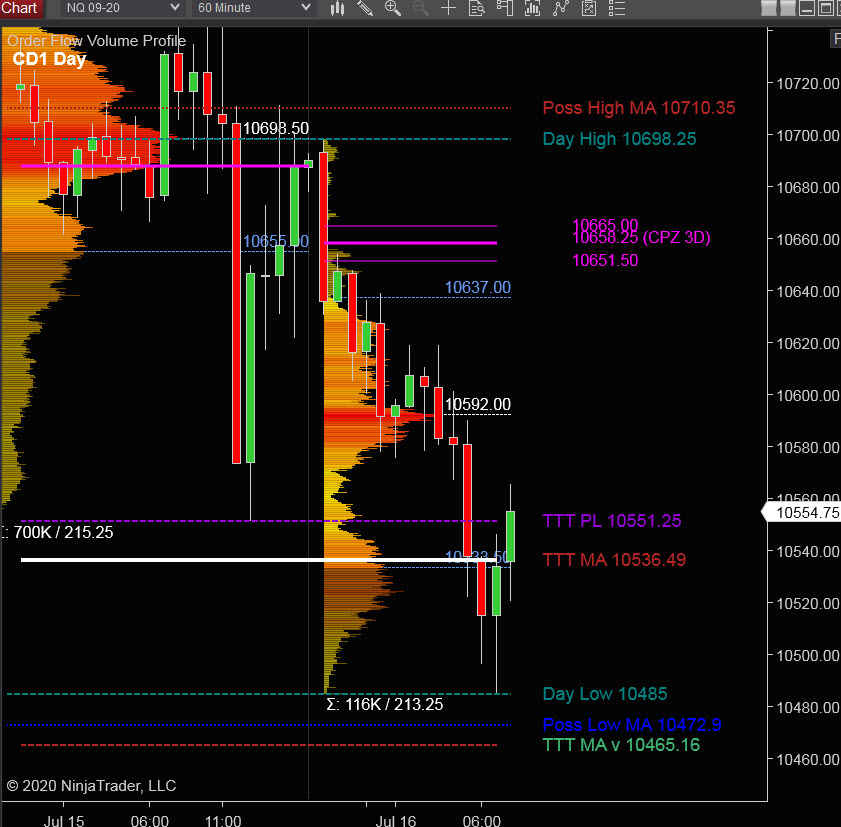
Nasdaq 100 (NQ)
Today is Cycle Day 1 (CD1)… Price has declined fulfilling CD1 Average Decline (10536.50). We then have two scenarios to consider for today’s trading.
P – VA High = 10745 P – VA Low = 10655 P – POC = 10698
Bull Scenario: IF Bulls hold bid above 10550, THEN initial upside estimate targets 10592 – 10637 zone.
Bear Scenario: IF Bears hold offer below 10550, THEN initial downside estimate targets 10472 – 10465 zone.
Range Projections and Key Levels (NQ) September 2020 (U) Contract
HOD ATR Range Projection: 10834; LOD ATR Range Projection: 10469; 3 Day Central Pivot: 10658; 10 Day Average True Range: 229; VIX: 28
Trade Strategy: Our tactical trade strategy will simply remain unaltered…We’ll be flexible to trade both long and short side from Decision Pivot Levels. Continue to focus on Bull/Bear Stackers and Premium/Discounts. As always, remaining in alignment with dominant intra-day force increases probabilities of producing winning trades.
Stay Focused…Non-Biased…Disciplined ALWAYS USE STOPS!
Good Trading…David
“Knowing is not enough, We must APPLY. Willing is not enough, We must DO.” –Bruce Lee
*****This trade strategy report is disseminated for “education only” and should not be viewed in any way as a recommendation to buy or sell futures products.”
PAST PERFORMANCE IS NOT NECESSARILY INDICATIVE OF FUTURE RESULTS
IMPORTANT NOTICE! No representation is being made that the use of this strategy or any system or trading methodology will generate profits. Past performance is not necessarily indicative of future results. There is substantial risk of loss associated with trading securities and options on equities. Only risk capital should be used to trade. Trading securities is not suitable for everyone.
Disclaimer: Futures, Options, and Currency trading all have large potential rewards, but they also have large potential risk. You must be aware of the risks and be willing to accept them in order to invest in these markets. Don’t trade with money you can’t afford to lose.
This website is neither a solicitation nor an offer to Buy/Sell futures, options, or currencies. No representation is being made that any account will or is likely to achieve profits or losses similar to those discussed on this web site. The past performance of any trading system or methodology is not necessarily indicative of future results.
CFTC RULE 4.41 –HYPOTHETICAL OR SIMULATED PERFORMANCE RESULTS HAVE CERTAIN LIMITATIONS. UNLIKE AN ACTUAL PERFORMANCE RECORD, SIMULATED RESULTS DO NOT REPRESENT ACTUAL TRADING. ALSO, SINCE THE TRADES HAVE NOT BEEN EXECUTED, THE RESULTS MAY HAVE UNDER-OR-OVER COMPENSATED FOR THE IMPACT, IF ANY, OF CERTAIN MARKET FACTORS, SUCH AS LACK OF LIQUIDITY. SIMULATED TRADING PROGRAMS IN GENERAL ARE ALSO SUBJECT TO THE FACT THAT THEY ARE DESIGNED WITH THE BENEFIT OF HINDSIGHT. NO REPRESENTATION IS BEING MADE THAT ANY ACCOUNT WILL OR IS LIKELY TO ACHIEVE PROFIT OR LOSSES SIMILAR TO THOSE SHOWN