
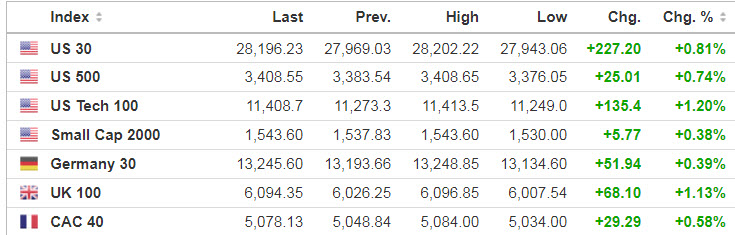
Markets
U.S. futures are pointing to another green session (Dow +0.6%, S&P 500 +0.7%, Nasdaq +0.9%) after the market kicked off the week with a broad-based rally. The Federal Reserve is set to begin a two-day policy meeting, where it is expected to maintain a dovish stance after earlier saying it will shift to a more relaxed approach on inflation.
Source: SeekingAlpha.com
Economic Calendar
FOMC meeting begins
8:30 Empire State Mfg Survey
8:30 Import/Export Prices
8:55 Redbook Chain Store Sales
9:15 Industrial Production
1:00 PM Results of $22B, 20-Year Bond Auction
https://www.investing.com/economic-calendar/
***New: PTG Trading Room Chat Log’s Link
S&P 500
Prior Session was Cycle Day 1 (CD1): Gap open held firm throughout the session as price continued its rally from last week. Range was 56.25 handles, slightly less than the 10-day average (77.35) with 1.3M contracts exchanged.
…Transition from Cycle Day 1 to Cycle Day 2
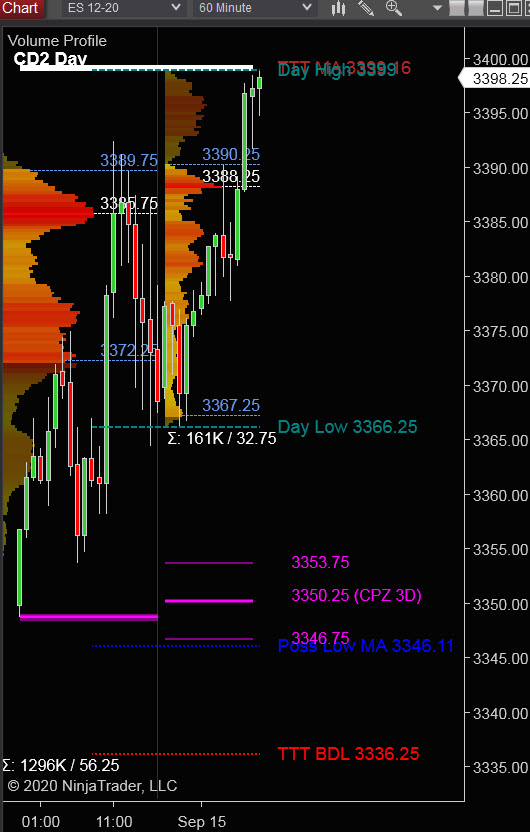
This leads us into Cycle Day 2 (CD2): Continuation rally is in-effect with price expanding above prior value zone. As such, there are two scenarios to consider for today’s trading.
1.) Price sustains a bid above 3390, initially targeting 3400 – 3408 zone.
2.) Price sustains an offer below 3390, initially targeting 3380 – 3375 zone.
*****3 Day Cycle has a 91% probability of fulfilling Positive Statistic covering 12 years of recorded tracking history.
PVA High Edge = 3390 PVA Low Edge = 3372 Prior POC = 3385
Range Projections and Key Levels (ES) December 2020 (Z) Contract
HOD ATR Range Projection: 3414; LOD ATR Range Projection: 3315; 3 Day Central Pivot: 3350; 3 Day Cycle Target: 3400; 10 Day Average True Range 77; VIX: 25
Nasdaq 100 (NQ)
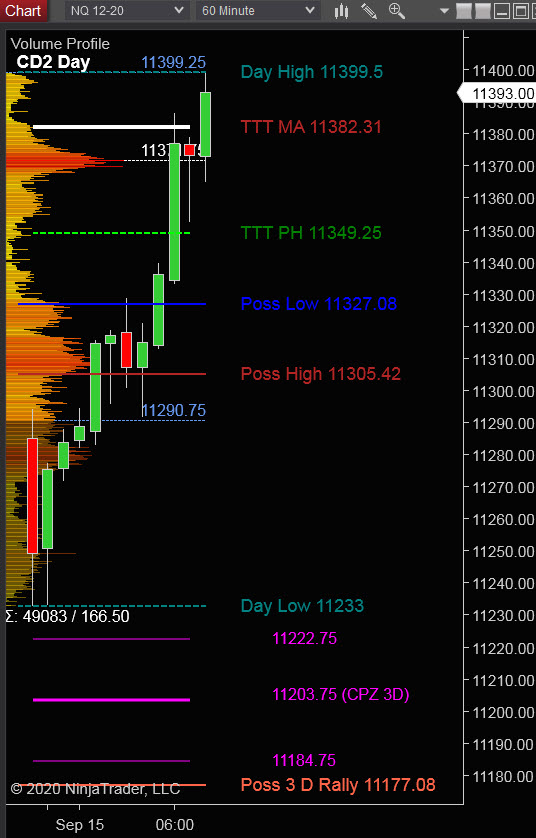
Today is Cycle Day 2 (CD2)…Price is expanding its current cycle rally trading above prior value zone. Prior range was 259.75 handles with 437K contracts exchanges. As such, there are two scenarios to consider for today’s trading:
PVA High Edge = 11475 PVA Low Edge = 11260 Prior POC = 11275
Bull Scenario: IF Bulls sustain a bid above 11350, THEN initial upside estimate targets 11382 – 11400 zone.
Bear Scenario: IF Bears sustain an offer below 11350, THEN initial downside estimate targets 11330 – 11300 zone.
Range Projections and Key Levels (NQ) December 2020 (Z) Contract
HOD ATR Range Projection: 11484; LOD ATR Range Projection: 10955; 3 Day Central Pivot: 11204; 3 Day Cycle Target: 11382; 10 Day Average True Range: 395; VIX: 30
Trade Strategy: Our tactical trade strategy will simply remain unaltered…We’ll be flexible to trade both long and short side from Decision Pivot Levels. Continue to focus on Bull/Bear Stackers and Premium/Discounts. As always, remaining in alignment with dominant intra-day force increases probabilities of producing winning trades.
Stay Focused…Non-Biased…Disciplined ALWAYS USE STOPS!
Good Trading…David
“Knowing is not enough, We must APPLY. Willing is not enough, We must DO.” –Bruce Lee
*****This trade strategy report is disseminated for “education only” and should not be viewed in any way as a recommendation to buy or sell futures products.”
PAST PERFORMANCE IS NOT NECESSARILY INDICATIVE OF FUTURE RESULTS
IMPORTANT NOTICE! No representation is being made that the use of this strategy or any system or trading methodology will generate profits. Past performance is not necessarily indicative of future results. There is substantial risk of loss associated with trading securities and options on equities. Only risk capital should be used to trade. Trading securities is not suitable for everyone.
Disclaimer: Futures, Options, and Currency trading all have large potential rewards, but they also have large potential risk. You must be aware of the risks and be willing to accept them in order to invest in these markets. Don’t trade with money you can’t afford to lose.
This website is neither a solicitation nor an offer to Buy/Sell futures, options, or currencies. No representation is being made that any account will or is likely to achieve profits or losses similar to those discussed on this web site. The past performance of any trading system or methodology is not necessarily indicative of future results.
CFTC RULE 4.41 –HYPOTHETICAL OR SIMULATED PERFORMANCE RESULTS HAVE CERTAIN LIMITATIONS. UNLIKE AN ACTUAL PERFORMANCE RECORD, SIMULATED RESULTS DO NOT REPRESENT ACTUAL TRADING. ALSO, SINCE THE TRADES HAVE NOT BEEN EXECUTED, THE RESULTS MAY HAVE UNDER-OR-OVER COMPENSATED FOR THE IMPACT, IF ANY, OF CERTAIN MARKET FACTORS, SUCH AS LACK OF LIQUIDITY. SIMULATED TRADING PROGRAMS IN GENERAL ARE ALSO SUBJECT TO THE FACT THAT THEY ARE DESIGNED WITH THE BENEFIT OF HINDSIGHT. NO REPRESENTATION IS BEING MADE THAT ANY ACCOUNT WILL OR IS LIKELY TO ACHIEVE PROFIT OR LOSSES SIMILAR TO THOSE SHOWN