
Markets

Off their overnight lows, U.S. stock index futures are still down 1% following a session that turned sour yesterday after the big Fed meeting. While the FOMC said interest rates could stay anchored to the zero-bound through 2023 (as the central bank tries to spur inflation), Jerome Powell kept asset purchases at current levels and sounded some alarm bells.
Source: Seeking Alpha https://seekingalpha.com/
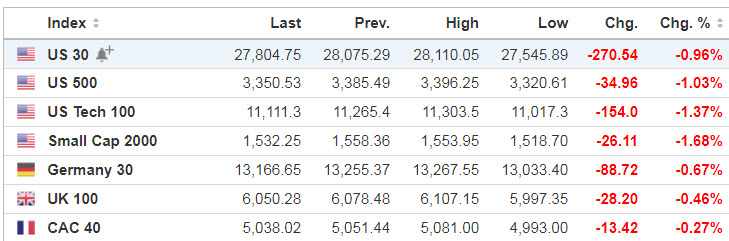
Source: https://www.investing.com/indices/indices-cfds
Economic Calendar
8:30 Initial Jobless Claims
8:30 Housing Starts
8:30 Philly Fed Business Outlook
10:30 EIA Natural Gas Inventory
4:30 PM Money Supply
4:30 PM Fed Balance Sheet
Source: https://www.investing.com/economic-calendar/
S&P 500 (ES)
Prior Session was Cycle Day 3 (CD3): FED announcement failed to excite traders as price broke key support (3390), unraveling into the close. Market on Close Sell Imbalance $1 Billion capped the session. Range was 45.75 handles with 1.466M contracts exchanged.
…Transition from Cycle Day 3 to Cycle Day 1
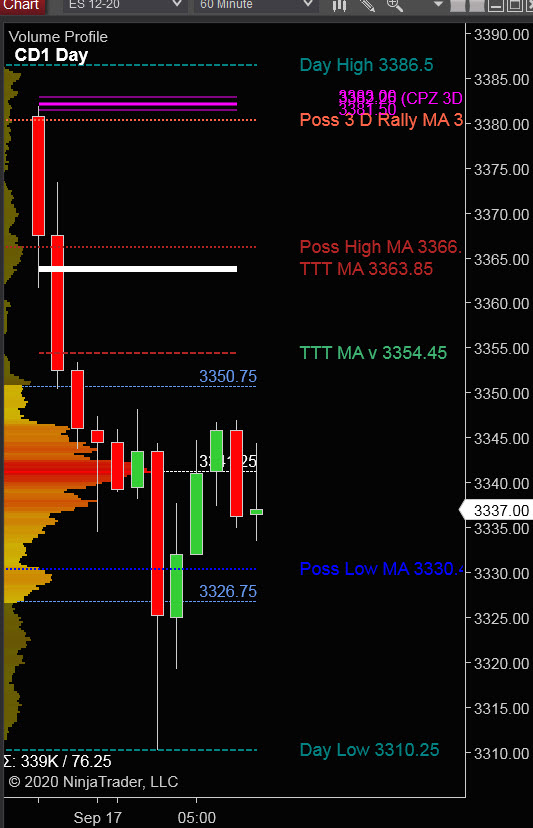
This leads us into Cycle Day 1 (CD1): Price has continued prior session sell-down, exceeding average decline projection (3363) for CD1. Price is currently trading off its deep low (3310.25). As such, there are two scenarios to consider for today’s trading.
1.) Price sustains a bid above 3340, initially targeting 3350 – 3365 zone.
2.) Price sustains an offer below 3340, initially targeting 3320 – 3310 zone.
P -VA High = 3414 P – VA Low = 3392 P – POC = 3403
Range Projections and Key Levels (ES) December 2020 (Z) Contract
HOD ATR Range Projection: 3448; LOD ATR Range Projection: 3318; 3 Day Central Pivot: 3382; 10 Day Average True Range 82; VIX: 27
Nasdaq 100 (NQ)
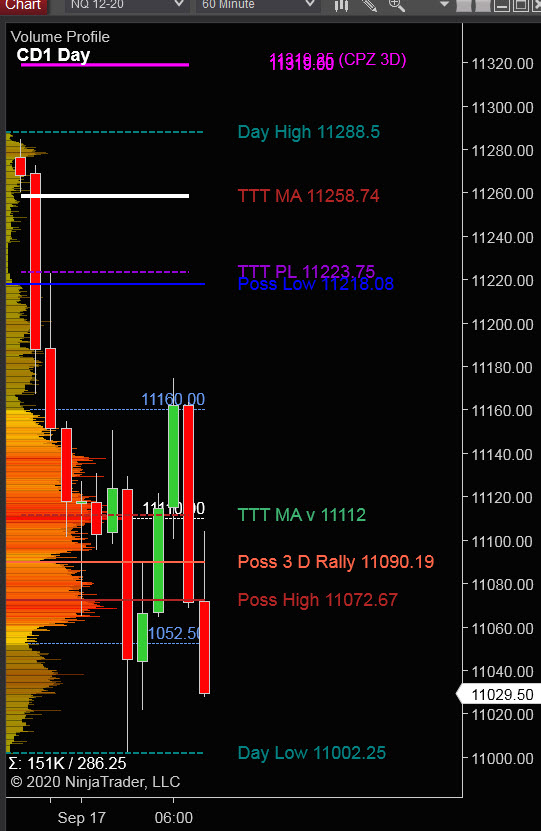
Today is Cycle Day 1 (CD1)… Price is continuing its selling pressure pre-RTH trading near lows of overnight session. As such, there are two scenarios to consider for today’s trading.
P – VA High = 11472 P – VA Low = 11336 P – POC = 11418
Bull Scenario: IF Bulls hold bid above 11050, THEN initial upside estimate targets 11100 – 11150 zone.
Bear Scenario: IF Bears hold offer below 11050, THEN initial downside estimate targets 11000 – 10990 zone.
Range Projections and Key Levels (NQ) December 2020 (Z) Contract
HOD ATR Range Projection: 11638; LOD ATR Range Projection: 10994; 3 Day Central Pivot: 11320; 10 Day Average True Range: 406; VIX: 27
Trade Strategy: Our tactical trade strategy will simply remain unaltered…We’ll be flexible to trade both long and short side from Decision Pivot Levels. Continue to focus on Bull/Bear Stackers and Premium/Discounts. As always, remaining in alignment with dominant intra-day force increases probabilities of producing winning trades.
Stay Focused…Non-Biased…Disciplined ALWAYS USE STOPS!
Good Trading…David
“Knowing is not enough, We must APPLY. Willing is not enough, We must DO.” –Bruce Lee
*****This trade strategy report is disseminated for “education only” and should not be viewed in any way as a recommendation to buy or sell futures products.”
PAST PERFORMANCE IS NOT NECESSARILY INDICATIVE OF FUTURE RESULTS
IMPORTANT NOTICE! No representation is being made that the use of this strategy or any system or trading methodology will generate profits. Past performance is not necessarily indicative of future results. There is substantial risk of loss associated with trading securities and options on equities. Only risk capital should be used to trade. Trading securities is not suitable for everyone.
Disclaimer: Futures, Options, and Currency trading all have large potential rewards, but they also have large potential risk. You must be aware of the risks and be willing to accept them in order to invest in these markets. Don’t trade with money you can’t afford to lose.
This website is neither a solicitation nor an offer to Buy/Sell futures, options, or currencies. No representation is being made that any account will or is likely to achieve profits or losses similar to those discussed on this web site. The past performance of any trading system or methodology is not necessarily indicative of future results.
CFTC RULE 4.41 –HYPOTHETICAL OR SIMULATED PERFORMANCE RESULTS HAVE CERTAIN LIMITATIONS. UNLIKE AN ACTUAL PERFORMANCE RECORD, SIMULATED RESULTS DO NOT REPRESENT ACTUAL TRADING. ALSO, SINCE THE TRADES HAVE NOT BEEN EXECUTED, THE RESULTS MAY HAVE UNDER-OR-OVER COMPENSATED FOR THE IMPACT, IF ANY, OF CERTAIN MARKET FACTORS, SUCH AS LACK OF LIQUIDITY. SIMULATED TRADING PROGRAMS IN GENERAL ARE ALSO SUBJECT TO THE FACT THAT THEY ARE DESIGNED WITH THE BENEFIT OF HINDSIGHT. NO REPRESENTATION IS BEING MADE THAT ANY ACCOUNT WILL OR IS LIKELY TO ACHIEVE PROFIT OR LOSSES SIMILAR TO THOSE SHOWN