
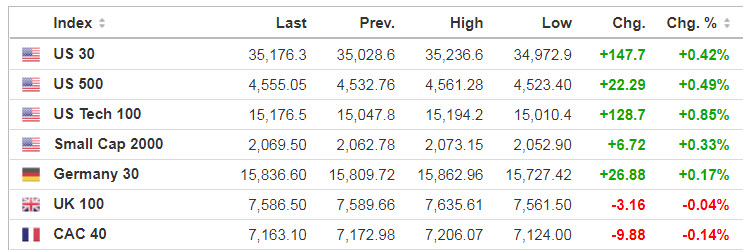
Markets
Technology stocks are officially in correction territory after yesterday’s late Wall Street selloff. The tech and growth focused Nasdaq 100 (NDX) (NASDAQ:QQQ) fell more than 1% in the previous session, bringing the decline from its high to 10.2%, the typical definition of a correction.
Source: SeekingAlpha.com
Economic Calendar
8:30 Initial Jobless Claims
8:30 Philly Fed Business Outlook
10:00 Existing Home Sales
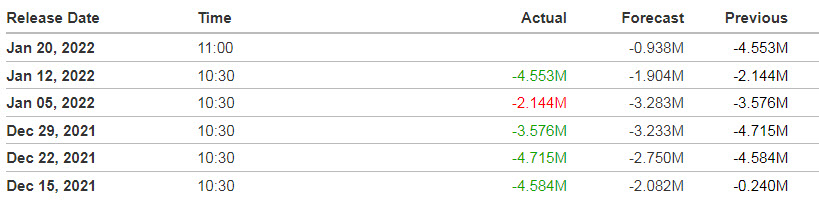
10:30 EIA Natural Gas Inventory
4:30 PM Fed Balance Sheet
https://www.investing.com/economic-calendar/
***New: PTG Trading Room Chat Log’s Link

11:00 EIA Petroleum Inventories
S&P 500

Prior Session was Cycle Day 2 (CD2): Early bids faded quickly as price reversed direction and persistent selling throughout this day ended with closing near lows. Range was 86 handles on 1.926M contracts exchanged.
…Transition from Cycle Day 2 to Cycle Day 3
This leads us into Cycle Day 3 (CD3): Price is currently trading below CD1 Low (4560) during overnight activity. Odds favor recovering back above this level during RTH, as there is historically a 91% chance of Positive 3 Day Cycle. Of course, flip-side is a failure with recent “risk-off” sentiment. As such, estimated scenarios to consider for today’s trading.
1.) Price sustains a bid above 4548, initially targets 4560 – 4565 zone.
2.) Price sustains an offer below 4548, initially targets 4530 – 4525 zone.
PVA High Edge = 4691 PVA Low Edge = 4638 Prior POC = 4684
Range Projections and Key Levels (ES) March 2022 (H) Contract
HOD ATR Range Projection: 4593; LOD ATR Range Projection: 4474; 3 Day Central Pivot: 4601; 3 Day Cycle Target: 4595; 10 Day Average True Range 79; VIX: 23
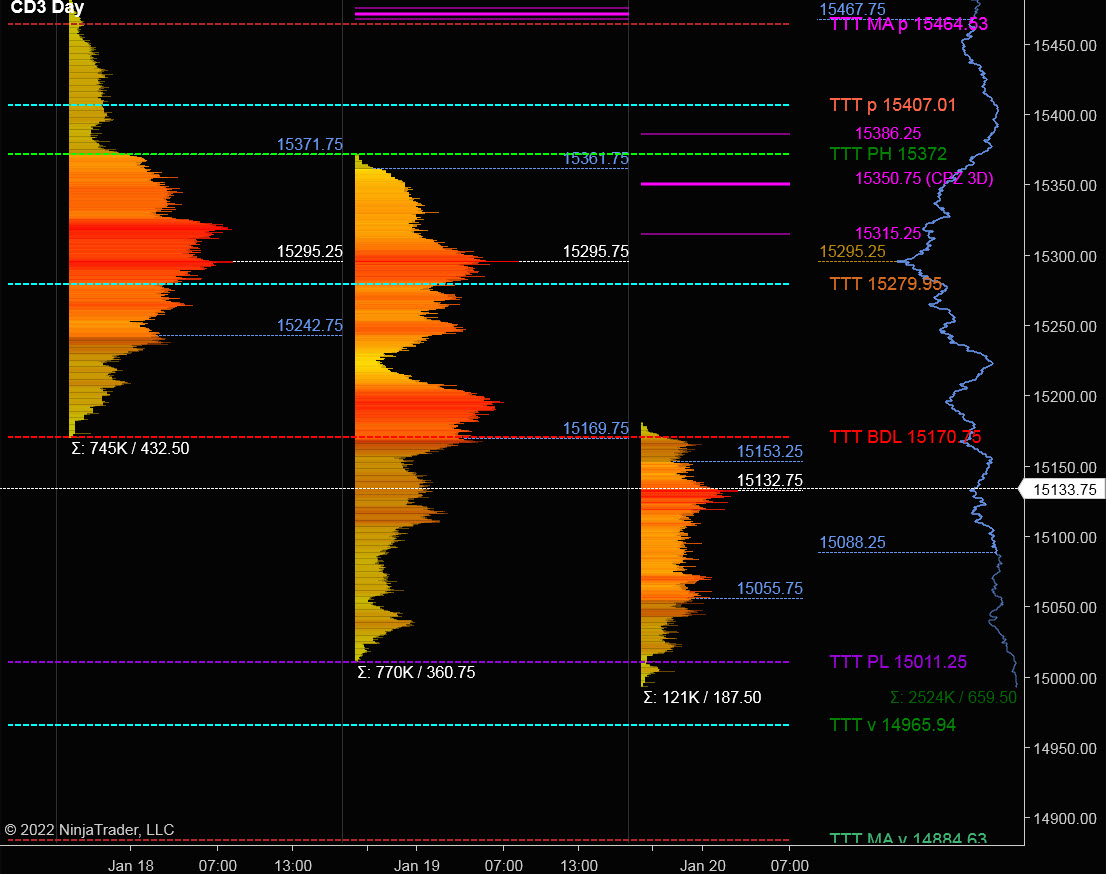
Nasdaq 100 (NQ)

Today is Cycle Day 3 (CD3)…Tech Sector is officially in “correction-mode” having dropped more than 10% from it’s highs. Overnight activity has price rebounding from previous session’s selling-spree. Prior range was 361 handles on 770k contracts exchanged. As such, there are two estimated scenarios to consider for today’s trading.
Bull Scenario: IF Bulls sustain a bid above 15100, THEN initial upside estimate targets 15150 – 15175 zone.
Bear Scenario: IF Bears sustain an offer below 15100, THEN initial downside estimate targets 15050 – 15025 zone.
PVA High Edge = 15362 PVA Low Edge = 15170 Prior POC = 15350
Range Projections and Key Levels (NQ) March 2022 (H) Contract
HOD ATR Range Projection: 15390; LOD ATR Range Projection: 14784; 3 Day Central Pivot: 15350; 3 Day Cycle Target: 15280; 10 Day Average True Range: 396; VIX: 23

Trade Strategy: Our tactical trade strategy will simply remain unaltered…We’ll be flexible to trade both long and short side from Decision Pivot Levels. Continue to focus on Bull/Bear Stackers and Premium/Discounts. As always, remaining in alignment with dominant intra-day force increases probabilities of producing winning trades.
Stay Focused…Non-Biased…Disciplined ALWAYS USE STOPS!
Good Trading…David
“Knowing is not enough, We must APPLY. Willing is not enough, We must DO.” –Bruce Lee
*****This trade strategy report is disseminated for “education only” and should not be viewed in any way as a recommendation to buy or sell futures products.”
PAST PERFORMANCE IS NOT NECESSARILY INDICATIVE OF FUTURE RESULTS
IMPORTANT NOTICE! No representation is being made that the use of this strategy or any system or trading methodology will generate profits. Past performance is not necessarily indicative of future results. There is substantial risk of loss associated with trading securities and options on equities. Only risk capital should be used to trade. Trading securities is not suitable for everyone.
Disclaimer: Futures, Options, and Currency trading all have large potential rewards, but they also have large potential risk. You must be aware of the risks and be willing to accept them in order to invest in these markets. Don’t trade with money you can’t afford to lose.
This website is neither a solicitation nor an offer to Buy/Sell futures, options, or currencies. No representation is being made that any account will or is likely to achieve profits or losses similar to those discussed on this web site. The past performance of any trading system or methodology is not necessarily indicative of future results.
CFTC RULE 4.41 –HYPOTHETICAL OR SIMULATED PERFORMANCE RESULTS HAVE CERTAIN LIMITATIONS. UNLIKE AN ACTUAL PERFORMANCE RECORD, SIMULATED RESULTS DO NOT REPRESENT ACTUAL TRADING. ALSO, SINCE THE TRADES HAVE NOT BEEN EXECUTED, THE RESULTS MAY HAVE UNDER-OR-OVER COMPENSATED FOR THE IMPACT, IF ANY, OF CERTAIN MARKET FACTORS, SUCH AS LACK OF LIQUIDITY. SIMULATED TRADING PROGRAMS IN GENERAL ARE ALSO SUBJECT TO THE FACT THAT THEY ARE DESIGNED WITH THE BENEFIT OF HINDSIGHT. NO REPRESENTATION IS BEING MADE THAT ANY ACCOUNT WILL OR IS LIKELY TO ACHIEVE PROFIT OR LOSSES SIMILAR TO THOSE SHOWN