
Markets

Source: SeekingAlpha.com
Economic Calendar
10:00 Leading Indicators
1:00 PM Baker-Hughes Rig Count
https://www.investing.com/economic-calendar/
***New: PTG Trading Room Chat Log’s Link
S&P 500

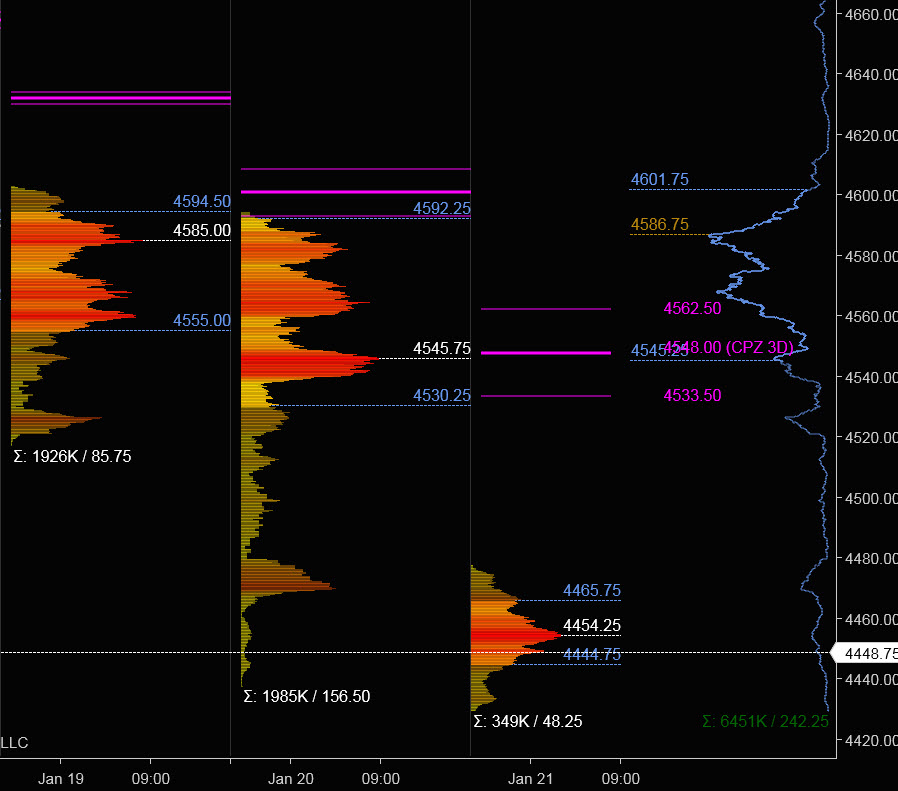
Prior Session was Cycle Day 3 (CD3): Once again morning rally secured a positive 3 Day Cycle Rally but failed to hold bid, as afternoon session “risk-off” selling accelerated into the closing bell. Prior range was 156 handles on 1.985M contracts exchanged.
…Transition from Cycle Day 3 to Cycle Day 1
This leads us into Cycle Day 1 (CD1): Today begins a new cycle, with the Average Decline measuring 4517 which has been exceeded during prior session. Price is currently trading back above PL (4437.75) attempting to stabilize yesterday’s selling-spree. It’s Fryday, so how this week closes will be important marker for the Market. As such, estimated scenarios to consider for today’s trading.
1.) Price sustains a bid above 4455, initially targets 4475 – 4480 zone.
2.) Price sustains an offer below 4455, initially targets 4430 – 4425 zone.
*****3 Day Cycle has a 91% probability of fulfilling Positive Cycle Statistics covering 12 years of recorded tracking history.
PVA High Edge = 4592 PVA Low Edge = 4530 Prior POC = 4546
Range Projections and Key Levels (ES) March 2022 (H) Contract
HOD ATR Range Projection: 4514; LOD ATR Range Projection: 4393; 3 Day Central Pivot: 4548; 3 Day Cycle Target: 4465; 10 Day Average True Range; 85; VIX: 27
Nasdaq 100 (NQ)

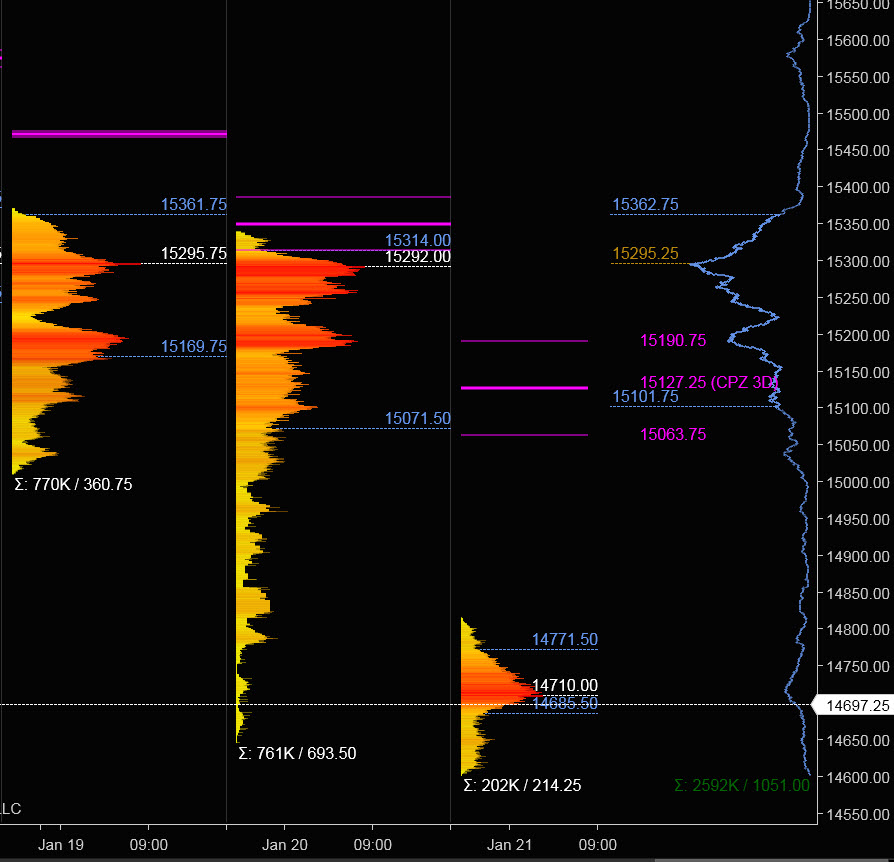
Today is Cycle Day 1 (CD1)…Tech Wreck continues with prior session’s selling-spree. Average Decline projection is 14933 which has been exceeded for this cycle day. Price is trading back above PL (14646.75) attempting to stabilize. Risk-Off momentum is firmly in-place, so week ending close will be an important marker for the Market Prior range was 694 handles on 761k contracts exchanged. As such, there are two estimated scenarios to consider for today’s trading.
PVA High Edge = 15314 PVA Low Edge = 15071 Prior POC = 15292
Bull Scenario: IF Bulls sustain a bid above 14715, THEN initial upside estimate targets 14772 – 14816 zone.
Bear Scenario: IF Bears sustain an offer below 14715, THEN initial downside estimate targets 14646– 14600 zone.
Range Projections and Key Levels (NQ) March 2022 (H) Contract
HOD ATR Range Projection: 15016; LOD ATR Range Projection: 14403; 3 Day Central Pivot: 15127; 3 Day Cycle Target: 14712; 10 Day Average True Range: 414; VIX: 27
Trade Strategy: Our tactical trade strategy will simply remain unaltered…We’ll be flexible to trade both long and short side from Decision Pivot Levels. Continue to focus on Bull/Bear Stackers and Premium/Discounts. As always, remaining in alignment with dominant intra-day force increases probabilities of producing winning trades.
Stay Focused…Non-Biased…Disciplined ALWAYS USE STOPS!
Good Trading…David
“Knowing is not enough, We must APPLY. Willing is not enough, We must DO.” –Bruce Lee
*****This trade strategy report is disseminated for “education only” and should not be viewed in any way as a recommendation to buy or sell futures products.”
PAST PERFORMANCE IS NOT NECESSARILY INDICATIVE OF FUTURE RESULTS
IMPORTANT NOTICE! No representation is being made that the use of this strategy or any system or trading methodology will generate profits. Past performance is not necessarily indicative of future results. There is substantial risk of loss associated with trading securities and options on equities. Only risk capital should be used to trade. Trading securities is not suitable for everyone.
Disclaimer: Futures, Options, and Currency trading all have large potential rewards, but they also have large potential risk. You must be aware of the risks and be willing to accept them in order to invest in these markets. Don’t trade with money you can’t afford to lose.
This website is neither a solicitation nor an offer to Buy/Sell futures, options, or currencies. No representation is being made that any account will or is likely to achieve profits or losses similar to those discussed on this web site. The past performance of any trading system or methodology is not necessarily indicative of future results.
CFTC RULE 4.41 –HYPOTHETICAL OR SIMULATED PERFORMANCE RESULTS HAVE CERTAIN LIMITATIONS. UNLIKE AN ACTUAL PERFORMANCE RECORD, SIMULATED RESULTS DO NOT REPRESENT ACTUAL TRADING. ALSO, SINCE THE TRADES HAVE NOT BEEN EXECUTED, THE RESULTS MAY HAVE UNDER-OR-OVER COMPENSATED FOR THE IMPACT, IF ANY, OF CERTAIN MARKET FACTORS, SUCH AS LACK OF LIQUIDITY. SIMULATED TRADING PROGRAMS IN GENERAL ARE ALSO SUBJECT TO THE FACT THAT THEY ARE DESIGNED WITH THE BENEFIT OF HINDSIGHT. NO REPRESENTATION IS BEING MADE THAT ANY ACCOUNT WILL OR IS LIKELY TO ACHIEVE PROFIT OR LOSSES SIMILAR TO THOSE SHOWN