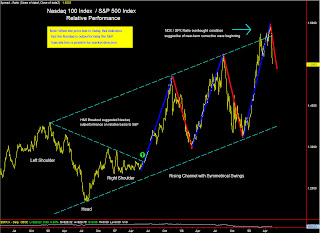
As the saying states: “So goes the Nasdaq…So goes the Market” This simply means that when the Nasdaq 100 Index is stronger relative to SP500 Index, the overall health of the markets are good and higher prices tend to be the result. So it is important for traders to keep a watchful eye on the relative performance of NAZ versus SP500. One simple way is to create a Relative Performance Chart or Ratio Chart between the two indexes.
The chart above shows the relative performance of the Nasdaq 100 ($NDX.X) and SP500 ($SPX.X) going back three years. Now why look back three years and what is its importance if I trade intra-day you ask? Well, it’s simple…Any knowledgeable trader worth his (her) salt always keeps track of how different markets are performing relative to the market he (she) is trading whether intra-day or on a swing basis. The markets today are globally linked so it’s critical to know how markets inter-act on a relative basis to develop an effective intra-day trading plan to capitalize on disparities.
Classical chart analysis can be done as effectively on ratio charts as they do on traditional bar charts. You’ll first notice the the ratio chart (again…we are comparing NDX v SP500) that price carved a significant Inverse Head & Shoulders Pattern during 2006. This suggested that Nasdaq would take a more pro-growth leadership role and investors should begin to overweight technology stocks. The Blue waves indicate NAZ outperformance and Red waves underformance versus SP500. The waves are very symmetrical defining the rising channel pattern You’ll notice that when the ratio hit the upper channel line Nasdaq entered a period of underformance and subsequently the markets corrected.
Fast forward to present day…Nasdaq has shown extraordinary leadership since the March lows with the ratio exceeding the upper channel line. Last week Nasdaq began to lose leadership and underperform the broader markets…Semiconductors were especially weak and that group needs closer observation for continued weakness or renewed strength.
Conclusion: With the Nasdaq beginning to exhibit relative weakness and market seasonality ( “Sell in May and Go Away”) this could be early signs of a beginning correction that many pundits have been calling for. We can never know for sure, but one fact does remain as supported by historical evidence…”So Goes the Nasdaq…So Goes the Market”
Good Trading

