
Markets
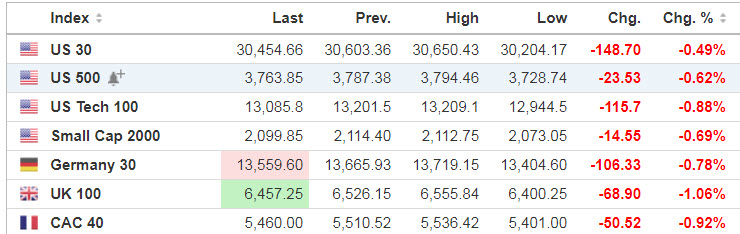
Source: SeekingAlpha.com
Economic Calendar
8:30 Personal Income and Outlays
8:30 Employment Cost Index
9:45 Chicago PMI
10:00 Pending Home Sales
10:00 Consumer Sentiment
1:00 PM Baker-Hughes Rig Count
***New: PTG Trading Room Chat Log’s Link
S&P 500

Prior Session was Cycle Day 1 (CD1): It was a “range-runner” day as price rallied during AM Session recovering prior days lost ground, only to reverse during PM Session to squelch earlier gains. Volatility remains elevated with VIX (34) and volumes tracking at twice the average. Range was 120 handles on 2.086M contracts exchanged.
…Transition from Cycle Day 1 to Cycle Day 2
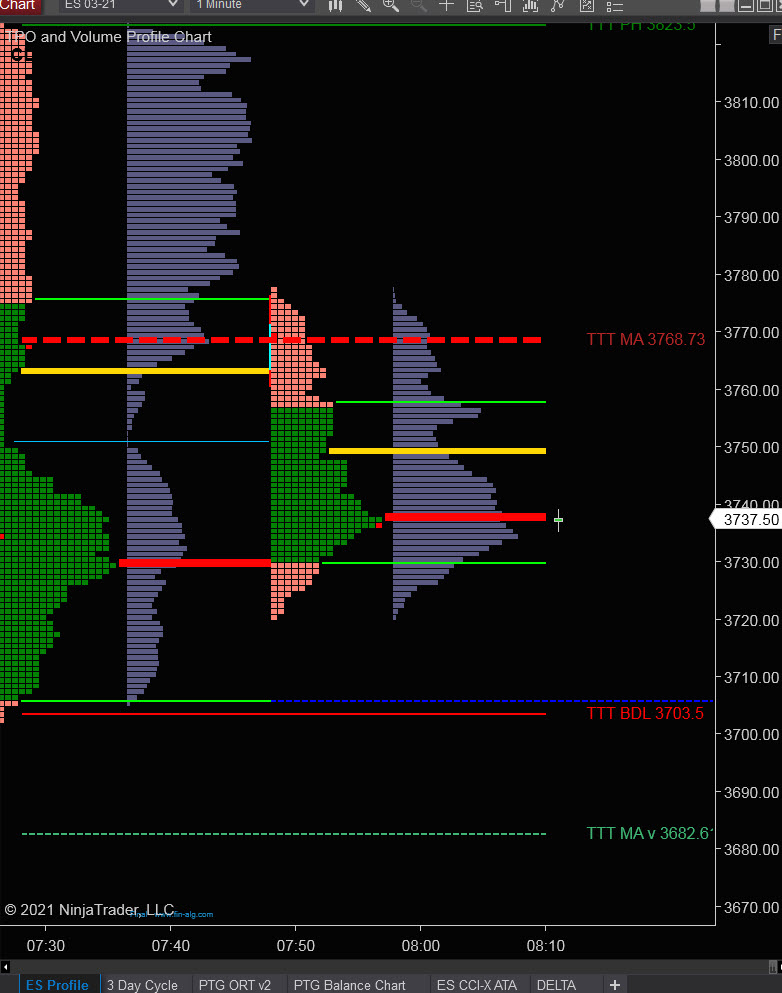
This leads us into Cycle Day 2 (CD2): Relatively quiet overnight trade as price is seeking to balance recent wide range volatility. So far CD1 Low (3703.50) has not been violated, as this level needs to hold to protect against further weakness. Key Value transition zone is between 3740 – 3720. This zone must be defended to avoid a lower shift of value. As such, there are two estimated scenarios to consider for today’s trading.
1.) Price sustains a bid above 3720, initially targets 3750 – 3770 zone.
2.) Price sustains an offer below 3720, initially targets 3700 – 3683 zone.
*****3 Day Cycle has a 91% probability of fulfilling Positive Statistic covering 12 years of recorded tracking history.
PVA High Edge = 3822 PVA Low Edge = 3773 Prior POC = 3811
Range Projections and Key Levels (ES) March 2021 (H) Contract
HOD ATR Range Projection: 3768; LOD ATR Range Projection: 3730; 3 Day Central Pivot: 3791; 3 Day Cycle Target: 3769; 10 Day Average True Range 47; VIX: 34
Nasdaq 100 (NQ)

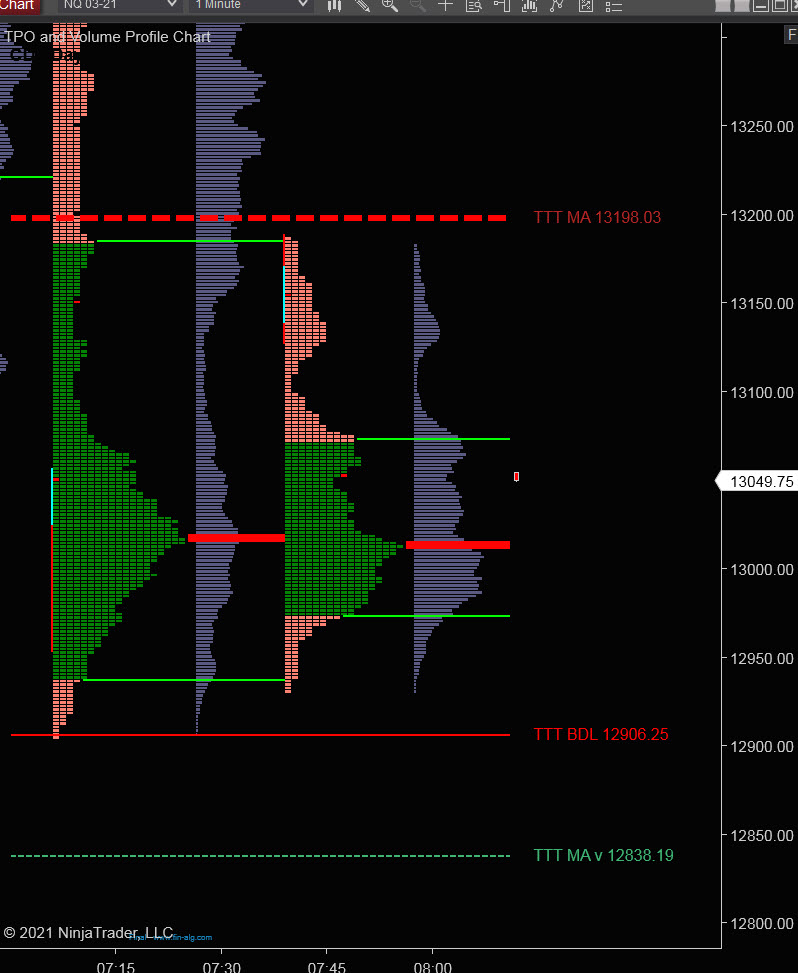
Today is Cycle Day 2 (CD2)…Price is currently trading below prior value zone and above CD1 Low (12906.25). Key cycle low will need to be defended to avoid further decline and value transition lower. Prior Range was 487.75 handles on 615 contracts exchanged. As such, there are two estimated scenarios to consider for today’s trading.
PVA High Edge = 13388 PVA Low Edge = 13151 Prior POC = 13242
Bull Scenario: IF Bulls sustain a bid above 12985, THEN initial upside estimate targets 13150 – 13200 zone.
Bear Scenario: IF Bears sustain an offer below 12985, THEN initial downside estimate targets 12900 – 12838 zone.
Range Projections and Key Levels (NQ) March 2021 (H) Contract
HOD ATR Range Projection: 13151; LOD ATR Range Projection: 12970; 3 Day Central Pivot: 13280; 3 Day Cycle Target: 13198; 10 Day Average True Range: 218; VIX: 34
Trade Strategy: Our tactical trade strategy will simply remain unaltered…We’ll be flexible to trade both long and short side from Decision Pivot Levels. Continue to focus on Bull/Bear Stackers and Premium/Discounts. As always, remaining in alignment with dominant intra-day force increases probabilities of producing winning trades.
Stay Focused…Non-Biased…Disciplined ALWAYS USE STOPS!
Good Trading…David
“Knowing is not enough, We must APPLY. Willing is not enough, We must DO.” –Bruce Lee
*****This trade strategy report is disseminated for “education only” and should not be viewed in any way as a recommendation to buy or sell futures products.”
PAST PERFORMANCE IS NOT NECESSARILY INDICATIVE OF FUTURE RESULTS
IMPORTANT NOTICE! No representation is being made that the use of this strategy or any system or trading methodology will generate profits. Past performance is not necessarily indicative of future results. There is substantial risk of loss associated with trading securities and options on equities. Only risk capital should be used to trade. Trading securities is not suitable for everyone.
Disclaimer: Futures, Options, and Currency trading all have large potential rewards, but they also have large potential risk. You must be aware of the risks and be willing to accept them in order to invest in these markets. Don’t trade with money you can’t afford to lose.
This website is neither a solicitation nor an offer to Buy/Sell futures, options, or currencies. No representation is being made that any account will or is likely to achieve profits or losses similar to those discussed on this web site. The past performance of any trading system or methodology is not necessarily indicative of future results.
CFTC RULE 4.41 –HYPOTHETICAL OR SIMULATED PERFORMANCE RESULTS HAVE CERTAIN LIMITATIONS. UNLIKE AN ACTUAL PERFORMANCE RECORD, SIMULATED RESULTS DO NOT REPRESENT ACTUAL TRADING. ALSO, SINCE THE TRADES HAVE NOT BEEN EXECUTED, THE RESULTS MAY HAVE UNDER-OR-OVER COMPENSATED FOR THE IMPACT, IF ANY, OF CERTAIN MARKET FACTORS, SUCH AS LACK OF LIQUIDITY. SIMULATED TRADING PROGRAMS IN GENERAL ARE ALSO SUBJECT TO THE FACT THAT THEY ARE DESIGNED WITH THE BENEFIT OF HINDSIGHT. NO REPRESENTATION IS BEING MADE THAT ANY ACCOUNT WILL OR IS LIKELY TO ACHIEVE PROFIT OR LOSSES SIMILAR TO THOSE SHOWN