
Markets
Flows that were also pulled from brokerages last week due to angst over restricted trading may also be coming back into the market, and futures are reflecting the renewed optimism: Dow +0.7%; S&P 500 +0.9%; Nasdaq +1.1%.

Source: SeekingAlpha.com
Economic Calendar
9:45 PMI Manufacturing Index
10:00 ISM Manufacturing Index
10:00 Construction Spending
2:00 PM Fed’s Bostic Speech
3:15 PM Fed’s Rosengren Speech
https://www.investing.com/economic-calendar/
***New: PTG Trading Room Chat Log’s Link
S&P 500

Prior Session was Cycle Day 2 (CD2): Wide range unfolded for this day with volatility elevated and risk-off at end of week/month. Range was 91.75 handles on 2.490M contracts exchanged.
…Transition from Cycle Day 2 to Cycle Day 3
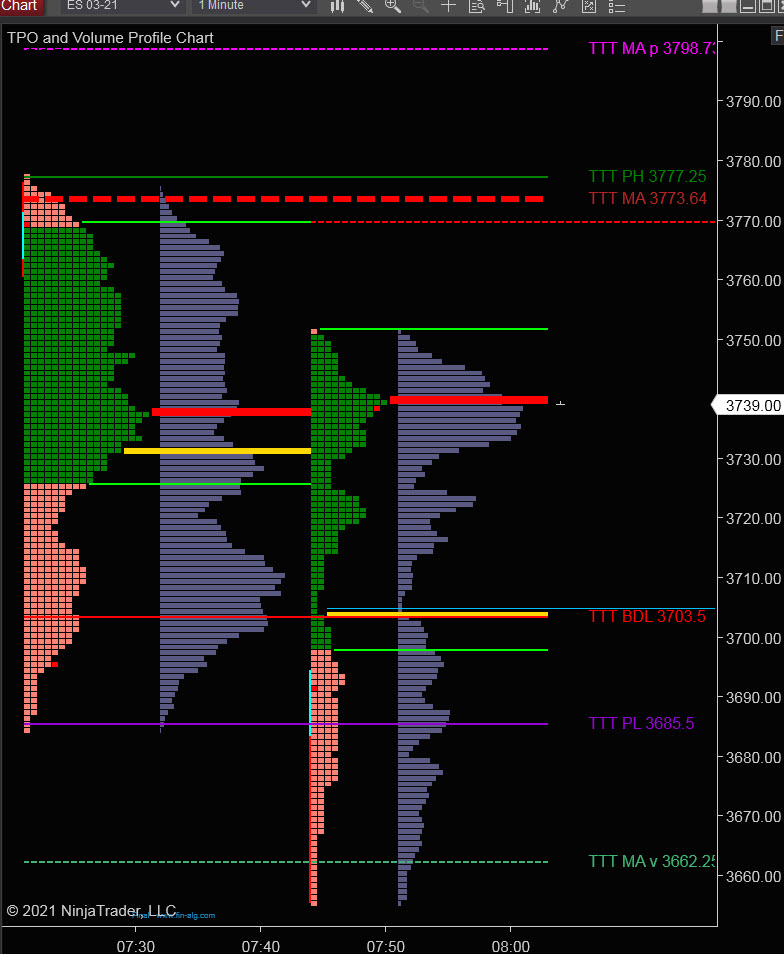
This leads us into Cycle Day 3 (CD3): Price declined overnight, violating CD1 (3703.50) fulfilling CD3 Violation Level (3662.25) before sharply reversing higher. Price has cleared back above CD1 (3703.50) achieving the 3 Day Central Pivot (3750.75). 3 Day Cycle Statistic has been fulfilled, so we will mark today as a “wild card”. As such, there are two estimated scenarios to consider for today’s trading.
1.) Price sustains a bid above 3750, initially targets 3770 – 3780 zone.
2.) Price sustains an offer below 3750, initially targets 3730 – 3720 zone.
*****3 Day Cycle has a 91% probability of fulfilling Positive Statistic covering 12 years of recorded tracking history.
PVA High Edge = 3745 PVA Low Edge = 3698 Prior POC = 3709
Range Projections and Key Levels (ES) March 2021 (H) Contract
HOD ATR Range Projection: 3708; LOD ATR Range Projection: 3699; 3 Day Central Pivot: 3750; 3 Day Cycle Target: 3773; 10 Day Average True Range 51; VIX: 31
Nasdaq 100 (NQ)

Today is Cycle Day 3 (CD3)…Price is currently trading back within prior value zone following overnight decline and reversal rally. Prior range was 359 handles on 706k contracts exchanged. As such, there are two estimated scenarios to consider for today’s trading.
PVA High Edge = 13148 PVA Low Edge = 12956 Prior POC = 12996
Bull Scenario: IF Bulls sustain a bid above 13040, THEN initial upside estimate targets 13102 – 13132 zone.
Bear Scenario: IF Bears sustain an offer below 13040, THEN initial downside estimate targets 12995 – 12955 zone.
Range Projections and Key Levels (NQ) March 2021 (H) Contract
HOD ATR Range Projection: 12962; LOD ATR Range Projection: 12849; 3 Day Central Pivot: 13102; 3 Day Cycle Target: 13218; 10 Day Average True Range: 235; VIX: 31

Trade Strategy: Our tactical trade strategy will simply remain unaltered…We’ll be flexible to trade both long and short side from Decision Pivot Levels. Continue to focus on Bull/Bear Stackers and Premium/Discounts. As always, remaining in alignment with dominant intra-day force increases probabilities of producing winning trades.
Stay Focused…Non-Biased…Disciplined ALWAYS USE STOPS!
Good Trading…David
“Knowing is not enough, We must APPLY. Willing is not enough, We must DO.” –Bruce Lee
*****This trade strategy report is disseminated for “education only” and should not be viewed in any way as a recommendation to buy or sell futures products.”
PAST PERFORMANCE IS NOT NECESSARILY INDICATIVE OF FUTURE RESULTS
IMPORTANT NOTICE! No representation is being made that the use of this strategy or any system or trading methodology will generate profits. Past performance is not necessarily indicative of future results. There is substantial risk of loss associated with trading securities and options on equities. Only risk capital should be used to trade. Trading securities is not suitable for everyone.
Disclaimer: Futures, Options, and Currency trading all have large potential rewards, but they also have large potential risk. You must be aware of the risks and be willing to accept them in order to invest in these markets. Don’t trade with money you can’t afford to lose.
This website is neither a solicitation nor an offer to Buy/Sell futures, options, or currencies. No representation is being made that any account will or is likely to achieve profits or losses similar to those discussed on this web site. The past performance of any trading system or methodology is not necessarily indicative of future results.
CFTC RULE 4.41 –HYPOTHETICAL OR SIMULATED PERFORMANCE RESULTS HAVE CERTAIN LIMITATIONS. UNLIKE AN ACTUAL PERFORMANCE RECORD, SIMULATED RESULTS DO NOT REPRESENT ACTUAL TRADING. ALSO, SINCE THE TRADES HAVE NOT BEEN EXECUTED, THE RESULTS MAY HAVE UNDER-OR-OVER COMPENSATED FOR THE IMPACT, IF ANY, OF CERTAIN MARKET FACTORS, SUCH AS LACK OF LIQUIDITY. SIMULATED TRADING PROGRAMS IN GENERAL ARE ALSO SUBJECT TO THE FACT THAT THEY ARE DESIGNED WITH THE BENEFIT OF HINDSIGHT. NO REPRESENTATION IS BEING MADE THAT ANY ACCOUNT WILL OR IS LIKELY TO ACHIEVE PROFIT OR LOSSES SIMILAR TO THOSE SHOWN