
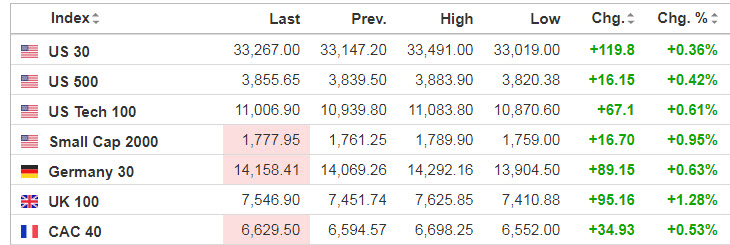
Markets
Source: SeekingAlpha.com
Economic Calendar

https://www.investing.com/economic-calendar/
S&P 500

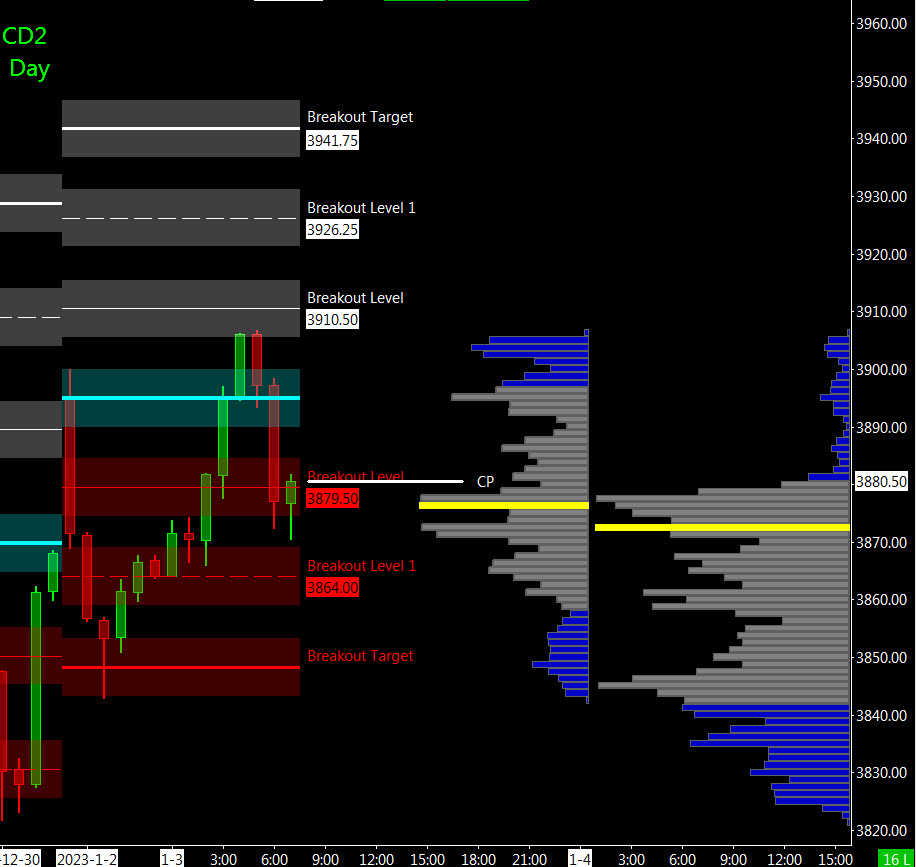
Prior Session was Cycle Day 1 (CD1): Normal CD1 as price declined establishing a Cycle Low at 3821.50. Prior range was 49 handles on 1.295M contracts exchanged.
…Transition from Cycle Day 1 to Cycle Day 2
This leads us into Cycle Day 2 (CD2): Normal for CD2 is for consolidation of recent trading range activity. Market is “waffling” overnight and pre-RTH to begin the new year. We @ PTG make no predictions for trade outcomes, rather focus on process. We are steadfast to our approach of aligning with the dominant force daily. We are basically directional traders and NEVER counter-trend. As such, estimated scenarios to consider for today’s trading.
Bull Scenario: Price sustains a bid above 3870, initially targets 3905 – 3910 zone.
Bear Scenario: Price sustains an offer below 3870, initially targets 3850 – 3845 zone.
PVA High Edge = 3850 PVA Low Edge = 3825 Prior POC = 3845
Range Projections and Key Levels (ES) March 2023 (H) Contract
HOD ATR Range Projection: 3915; LOD ATR Range Projection: 3835; 3 Day Central Pivot: 3845; 3 Day Cycle Target: 3912; 10 Day Average True Range 72; VIX: 23
Nasdaq 100 (NQ)

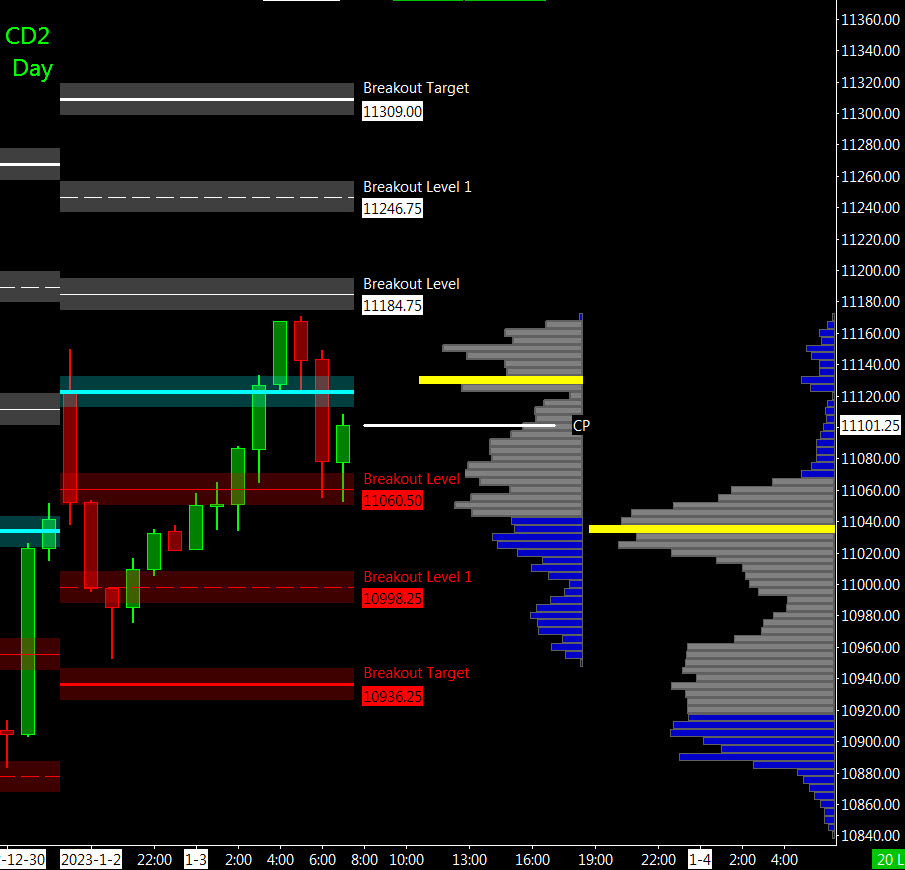
Prior Session was Cycle Day 1 (CD1): Normal CD1 as price declined establishing a Low at 10855.50. Prior range was 196 handles on 475k contracts exchanged.
…Transition from Cycle Day 1 to Cycle Day 2
Today is Cycle Day 2 (CD2)…Normal for CD2 is for consolidation of recent trading range activity. As such, estimated scenarios to consider for today’s trading. As such, estimated scenarios to consider for today’s trading.
Bull Scenario: IF Bulls sustains bid above 11050, THEN initial upside estimate targets 11170– 11180 zone.
Bear Scenario: IF Bears sustains offer below 11050, THEN initial downside estimate targets 10950 – 10930 zone.
PVA High Edge = 10955 PVA Low Edge = 10888 Prior POC = 10905
Range Projections and Key Levels (NQ) March 2022 (H) Contract
HOD ATR Range Projection: 11218; LOD ATR Range Projection: 10904; 3 Day Central Pivot: 10930; 3 Day Cycle Target: 11181; 10 Day Average True Range: 266; VIX: 23
Trade Strategy: Our tactical trade strategy will simply remain unaltered…We’ll be flexible to trade both long and short side from Decision Pivot Levels. Continue to focus on Bull/Bear Stackers and Premium/Discounts. As always, remaining in alignment with dominant intra-day force increases probabilities of producing winning trades.
Stay Focused…Non-Biased…Disciplined ALWAYS USE STOPS!
Good Trading…David
“Knowing is not enough, We must APPLY. Willing is not enough, We must DO.” –Bruce Lee
*****This trade strategy report is disseminated for “education only” and should not be viewed in any way as a recommendation to buy or sell futures products.”
PAST PERFORMANCE IS NOT NECESSARILY INDICATIVE OF FUTURE RESULTS
IMPORTANT NOTICE! No representation is being made that the use of this strategy or any system or trading methodology will generate profits. Past performance is not necessarily indicative of future results. There is substantial risk of loss associated with trading securities and options on equities. Only risk capital should be used to trade. Trading securities is not suitable for everyone.
Disclaimer: Futures, Options, and Currency trading all have large potential rewards, but they also have large potential risk. You must be aware of the risks and be willing to accept them in order to invest in these markets. Don’t trade with money you can’t afford to lose.
This website is neither a solicitation nor an offer to Buy/Sell futures, options, or currencies. No representation is being made that any account will or is likely to achieve profits or losses similar to those discussed on this web site. The past performance of any trading system or methodology is not necessarily indicative of future results.
CFTC RULE 4.41 –HYPOTHETICAL OR SIMULATED PERFORMANCE RESULTS HAVE CERTAIN LIMITATIONS. UNLIKE AN ACTUAL PERFORMANCE RECORD, SIMULATED RESULTS DO NOT REPRESENT ACTUAL TRADING. ALSO, SINCE THE TRADES HAVE NOT BEEN EXECUTED, THE RESULTS MAY HAVE UNDER-OR-OVER COMPENSATED FOR THE IMPACT, IF ANY, OF CERTAIN MARKET FACTORS, SUCH AS LACK OF LIQUIDITY. SIMULATED TRADING PROGRAMS IN GENERAL ARE ALSO SUBJECT TO THE FACT THAT THEY ARE DESIGNED WITH THE BENEFIT OF HINDSIGHT. NO REPRESENTATION IS BEING MADE THAT ANY ACCOUNT WILL OR IS LIKELY TO ACHIEVE PROFIT OR LOSSES SIMILAR TO THOSE SHOWN