
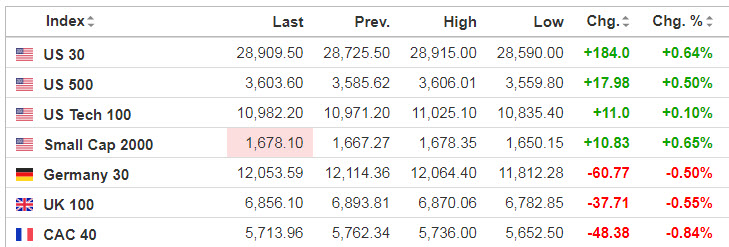
Markets
During the third quarter of 2022, the Federal Reserve jacked up its key policy rate by 150 points across two meetings, accounting for half of its rate hikes since it started tightening policy in March. That, and Fed officials’ insistence that they’ll keep rates higher for longer to beat down inflation, put a damper on asset prices. The S&P 500 (SP500) closed Q3 down a total of 5.3%, with the benchmark index ending in bear market territory for a second consecutive quarter.
Source: SeekingAlpha.com
Economic Calendar
9:45 PMI Manufacturing Index
10:00 ISM Manufacturing Index
10:00 Construction Spending
11:45 Fed’s Barkin Speech
12:30 PM Investor Movement Index
2:15 PM Fed’s George Speech
https://www.investing.com/economic-calendar/
***New: PTG Trading Room Chat Log’s Link
S&P 500

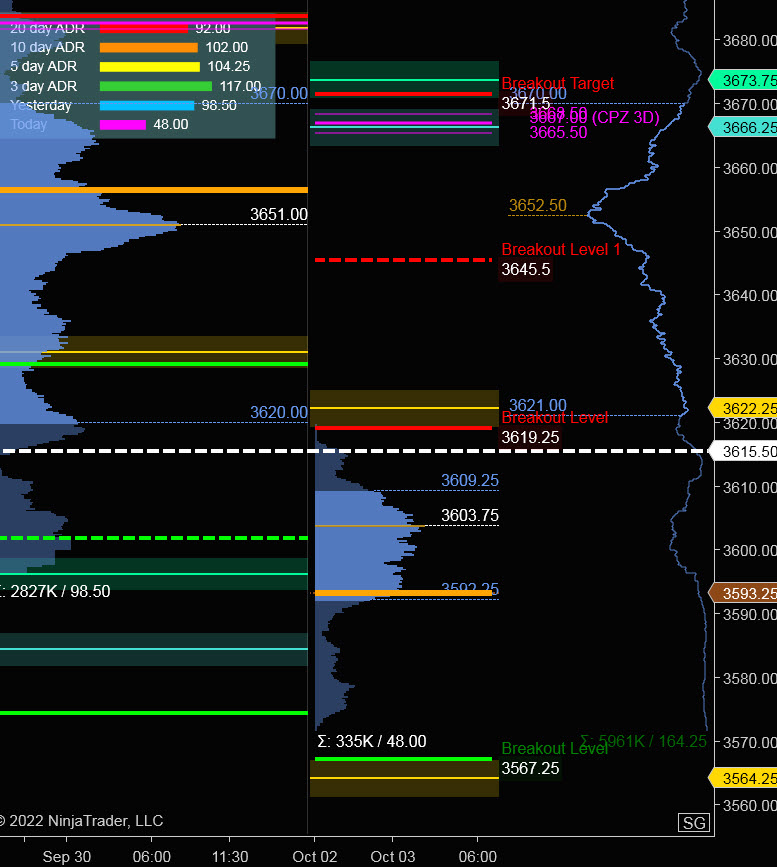
Prior Session was Cycle Day 3 (CD3): Markets produced a positive 3-Day Cycle, though ended the Month/Quarter settling near lows of the day. Prior range was 99 handles on 2.827M contracts exchanged.
…Transition from Cycle Day 3 to Cycle Day 1
This leads us into Cycle Day 1 (CD1): Average Decline for CD1 measures 3661, which has been surpassed during prior session. Price fulfilled lower Violation Zone during GLOBEX at which time buy response unfolded. As such, estimated scenarios to consider for today’s trading.
Bull Scenario: Price sustains a bid above 3620, initially targets 3635 – 3650 zone.
Bear Scenario: Price sustains an offer below 3620, initially targets 3578 – 3575 zone.
PVA High Edge = 3670 PVA Low Edge = 3620 Prior POC = 3651
Range Projections and Key Levels (ES) December 2022 (Z) Contract
HOD ATR Range Projection: 3673; LOD ATR Range Projection: 3518; 3 Day Central Pivot: 3668; 3 Day Cycle Target: 3610; 10 Day Average True Range 102; VIX: 32
Nasdaq 100 (NQ)

Today is Cycle Day 1 (CD1)…Average Decline for CD1 measures 11047. Prior range was 333 handles on 865k contracts exchanged. As such, there are two estimated scenarios to consider for today’s trading.
Bull Scenario: IF Bulls sustains bid above 11024, THEN initial upside estimate targets 11100– 11125 zone.
Bear Scenario: IF Bears sustains offer below 11024, THEN initial downside estimate targets 10935 – 10920 zone.
PVA High Edge = 11345 PVA Low Edge = 11180 Prior POC = 11234
Range Projections and Key Levels (NQ) December 2022 (Z) Contract
HOD ATR Range Projection: 11249; LOD ATR Range Projection: 10702; 3 Day Central Pivot: 11292; 3 Day Cycle Target: 11271; 10 Day Average True Range: 358; VIX: 32

Trade Strategy: Our tactical trade strategy will simply remain unaltered…We’ll be flexible to trade both long and short side from Decision Pivot Levels. Continue to focus on Bull/Bear Stackers and Premium/Discounts. As always, remaining in alignment with dominant intra-day force increases probabilities of producing winning trades.
Stay Focused…Non-Biased…Disciplined ALWAYS USE STOPS!
Good Trading…David
“Knowing is not enough, We must APPLY. Willing is not enough, We must DO.” –Bruce Lee
*****This trade strategy report is disseminated for “education only” and should not be viewed in any way as a recommendation to buy or sell futures products.”
PAST PERFORMANCE IS NOT NECESSARILY INDICATIVE OF FUTURE RESULTS
IMPORTANT NOTICE! No representation is being made that the use of this strategy or any system or trading methodology will generate profits. Past performance is not necessarily indicative of future results. There is substantial risk of loss associated with trading securities and options on equities. Only risk capital should be used to trade. Trading securities is not suitable for everyone.
Disclaimer: Futures, Options, and Currency trading all have large potential rewards, but they also have large potential risk. You must be aware of the risks and be willing to accept them in order to invest in these markets. Don’t trade with money you can’t afford to lose.
This website is neither a solicitation nor an offer to Buy/Sell futures, options, or currencies. No representation is being made that any account will or is likely to achieve profits or losses similar to those discussed on this web site. The past performance of any trading system or methodology is not necessarily indicative of future results.
CFTC RULE 4.41 –HYPOTHETICAL OR SIMULATED PERFORMANCE RESULTS HAVE CERTAIN LIMITATIONS. UNLIKE AN ACTUAL PERFORMANCE RECORD, SIMULATED RESULTS DO NOT REPRESENT ACTUAL TRADING. ALSO, SINCE THE TRADES HAVE NOT BEEN EXECUTED, THE RESULTS MAY HAVE UNDER-OR-OVER COMPENSATED FOR THE IMPACT, IF ANY, OF CERTAIN MARKET FACTORS, SUCH AS LACK OF LIQUIDITY. SIMULATED TRADING PROGRAMS IN GENERAL ARE ALSO SUBJECT TO THE FACT THAT THEY ARE DESIGNED WITH THE BENEFIT OF HINDSIGHT. NO REPRESENTATION IS BEING MADE THAT ANY ACCOUNT WILL OR IS LIKELY TO ACHIEVE PROFIT OR LOSSES SIMILAR TO THOSE SHOWN