
Markets

Source: Seeking Alpha https://seekingalpha.com/
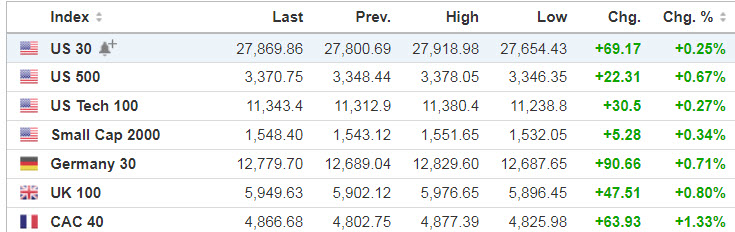
Source: https://www.investing.com/indices/indices-cfds
Economic Calendar
9:45 PMI Composite Final
10:00 ISM Non-Manufacturing Index
12:30 PM TD Ameritrade IMX
Source: https://www.investing.com/economic-calendar/
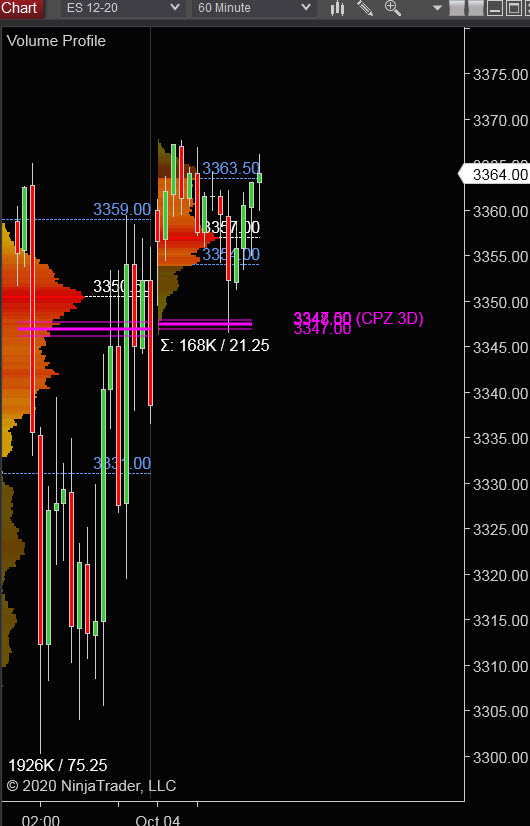
S&P 500 (ES)

Prior Session was Cycle Day 3 (CD3): Positive Cycle Statistic had been fulfilled early in this cycle with the rally reaching price objectives. Failing to expand further opened the door for decline, which happened, as price pushed down past 3317, normally a CD1 Average Decline that occurred on CD3. Range was 75.25 on 1.926M contracts exchanged.
…Transition from Cycle Day 3 to Cycle Day 1
This leads us into Cycle Day 1 (CD1): Since the Average Decline (3317) was fulfilled on CD3, followed by the initial rally off this level, price is stable during overnight trade, holding above 3 Day Central Pivot (3350). As such, there are two scenarios to consider for today’s trading.
1.) Price sustains a bid above 3350, initially targeting 3365 – 3375 zone and extended target measuring 3379.
2.) Price sustains an offer below 3350, initially targeting 3335 – 3330 zone.
P -VA High = 3360 P – VA Low = 3330 P – POC = 3350
Range Projections and Key Levels (ES) December 2020 (Z) Contract
HOD ATR Range Projection: 3410; LOD ATR Range Projection: 3304; 3 Day Central Pivot: 3350; 3 Day Cycle Target: 3379; 10 Day Average True Range 63; VIX: 29
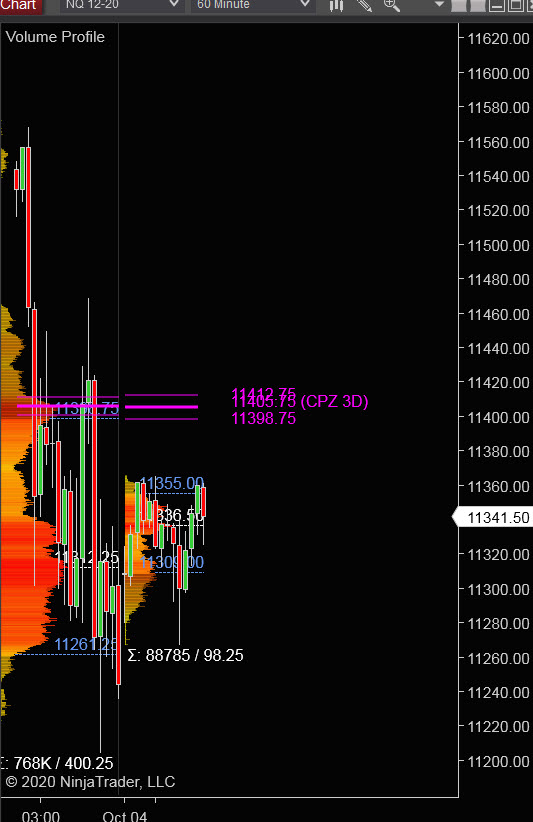
Nasdaq 100 (NQ)

Today is Cycle Day 1 (CD1)… Price declined during overnight trade fulfilling 11299 CD1 Average Decline, at which time price rallied achieving 3 Day Cycle Objective (11356.50) As such, there are two scenarios to consider for today’s trading.
P – VA High = 11355 P – VA Low = 11308 P – POC = 11337
Bull Scenario: IF Bulls hold bid above 11337, THEN initial upside estimate targets 11357 – 11365 zone.
Bear Scenario: IF Bears hold offer below 11337, THEN initial downside estimate targets 11310 – 11300 zone.
Range Projections and Key Levels (NQ) December 2020 (Z) Contract
HOD ATR Range Projection: 11538; LOD ATR Range Projection: 11095; 3 Day Central Pivot: 11406; 3 Day Cycle Target: 11357; 10 Day Average True Range: 270; VIX: 29
Trade Strategy: Our tactical trade strategy will simply remain unaltered…We’ll be flexible to trade both long and short side from Decision Pivot Levels. Continue to focus on Bull/Bear Stackers and Premium/Discounts. As always, remaining in alignment with dominant intra-day force increases probabilities of producing winning trades.
Stay Focused…Non-Biased…Disciplined ALWAYS USE STOPS!
Good Trading…David
“Knowing is not enough, We must APPLY. Willing is not enough, We must DO.” –Bruce Lee
*****This trade strategy report is disseminated for “education only” and should not be viewed in any way as a recommendation to buy or sell futures products.”
PAST PERFORMANCE IS NOT NECESSARILY INDICATIVE OF FUTURE RESULTS
IMPORTANT NOTICE! No representation is being made that the use of this strategy or any system or trading methodology will generate profits. Past performance is not necessarily indicative of future results. There is substantial risk of loss associated with trading securities and options on equities. Only risk capital should be used to trade. Trading securities is not suitable for everyone.
Disclaimer: Futures, Options, and Currency trading all have large potential rewards, but they also have large potential risk. You must be aware of the risks and be willing to accept them in order to invest in these markets. Don’t trade with money you can’t afford to lose.
This website is neither a solicitation nor an offer to Buy/Sell futures, options, or currencies. No representation is being made that any account will or is likely to achieve profits or losses similar to those discussed on this web site. The past performance of any trading system or methodology is not necessarily indicative of future results.
CFTC RULE 4.41 –HYPOTHETICAL OR SIMULATED PERFORMANCE RESULTS HAVE CERTAIN LIMITATIONS. UNLIKE AN ACTUAL PERFORMANCE RECORD, SIMULATED RESULTS DO NOT REPRESENT ACTUAL TRADING. ALSO, SINCE THE TRADES HAVE NOT BEEN EXECUTED, THE RESULTS MAY HAVE UNDER-OR-OVER COMPENSATED FOR THE IMPACT, IF ANY, OF CERTAIN MARKET FACTORS, SUCH AS LACK OF LIQUIDITY. SIMULATED TRADING PROGRAMS IN GENERAL ARE ALSO SUBJECT TO THE FACT THAT THEY ARE DESIGNED WITH THE BENEFIT OF HINDSIGHT. NO REPRESENTATION IS BEING MADE THAT ANY ACCOUNT WILL OR IS LIKELY TO ACHIEVE PROFIT OR LOSSES SIMILAR TO THOSE SHOWN